Spring Boot metrics monitoring using elasticsearch and kibana
One of the most frequently mentioned challenges related to the creation of microservices based architecture is monitoring. Each microservice should be run on an environment isolated from the other microservices, so it does not share resources such as databases or log files with them.
Spring Boot provides actuator to monitor and manage our application. Actuator is a tool which has HTTP endpoints. when application is pushed to production, you can choose to monitor your application using HTTP endpoints. In this post will see how to ship Spring boot actuator to elasticsearch and monitor our app(s) from Kibana dashboard.
Spring Boot Confirguration
In order for metrics to be available in our app, we just add the Actuator dependency to it:
      <dependency>
        <groupId>org.springframework.boot</groupId>
        <artifactId>spring-boot-starter-actuator</artifactId>
      </dependency>
For the sake of simplicity, I disabled security for actuator endpoints by adding these lines my application.yml
management:
  security:
    enabled: false
HTTPBeat
Httpbeat is a Beat used to call HTTP endpoints and ship the result to the configured output channel, e.g. Logstash and Elasticsearch...
In this article, we will monitor just 2 actuator endpoints /health and /metrics. the httpbeat.yml config file is something like:
      ######################## Httpbeat Configuration Example ########################

      ############################## Httpbeat ########################################
      httpbeat:

        hosts:
          # Each - Host endpoints to call. Below are the host endpoint specific configurations
          -
            schedule: "@every 30s"
            url: http://localhost:8080/health
            method: get
            headers:
              Accept: application/json
            output_format: json
            json_dot_mode: replace

          -
            schedule: "@every 30s"
            url: http://localhost:8080/metrics
            method: get
            headers:
              Accept: application/json
            output_format: json
            json_dot_mode: replace

      #================================ General =====================================
      fields:
        app_id: test_app

      #----------------------------- Logstash output --------------------------------
      output.elasticsearch:
        hosts: ["localhost:9200"]
        index: "httpbeat-%{+yyyy.MM.dd}"
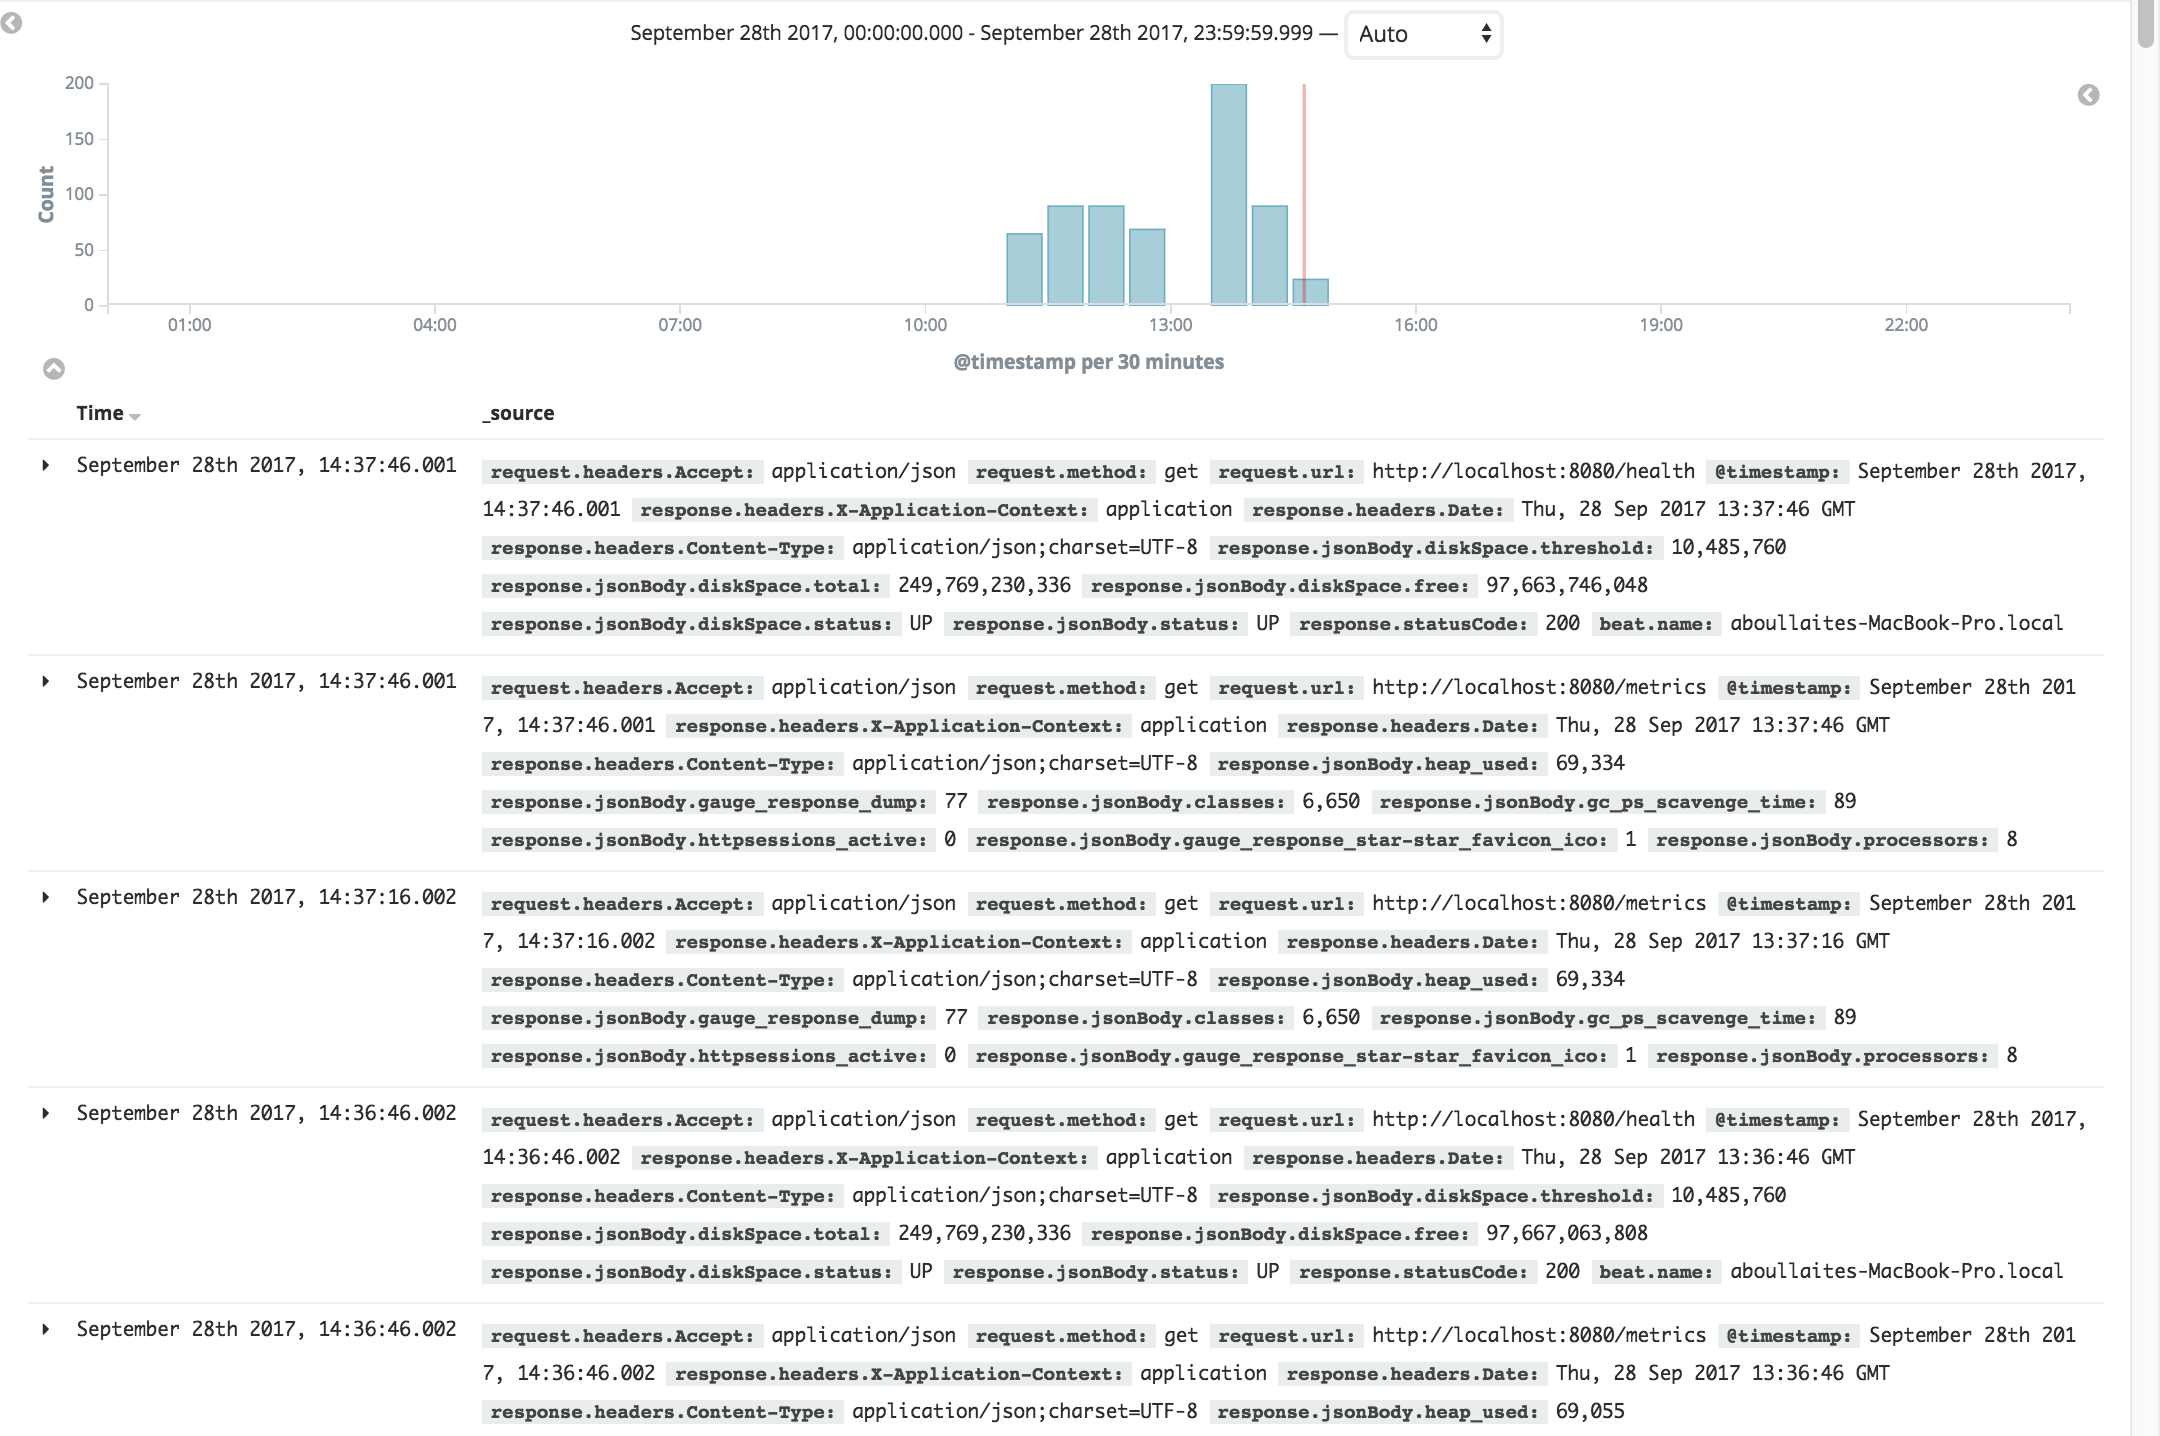
As you can see, Httpbeat calls every 30s the 2 endpoints. It's important to set json_dot_mode to replace to avoid errors since some of the values in the metrics response contain a dot ('.'). I also added a app_id field to identify my app.
To check if our configuration is fine, let's execute this curl command to list available indices:
curl -XGET 'localhost:9200/_cat/indices?v&pretty'
We should see httpbeat-... index in the list

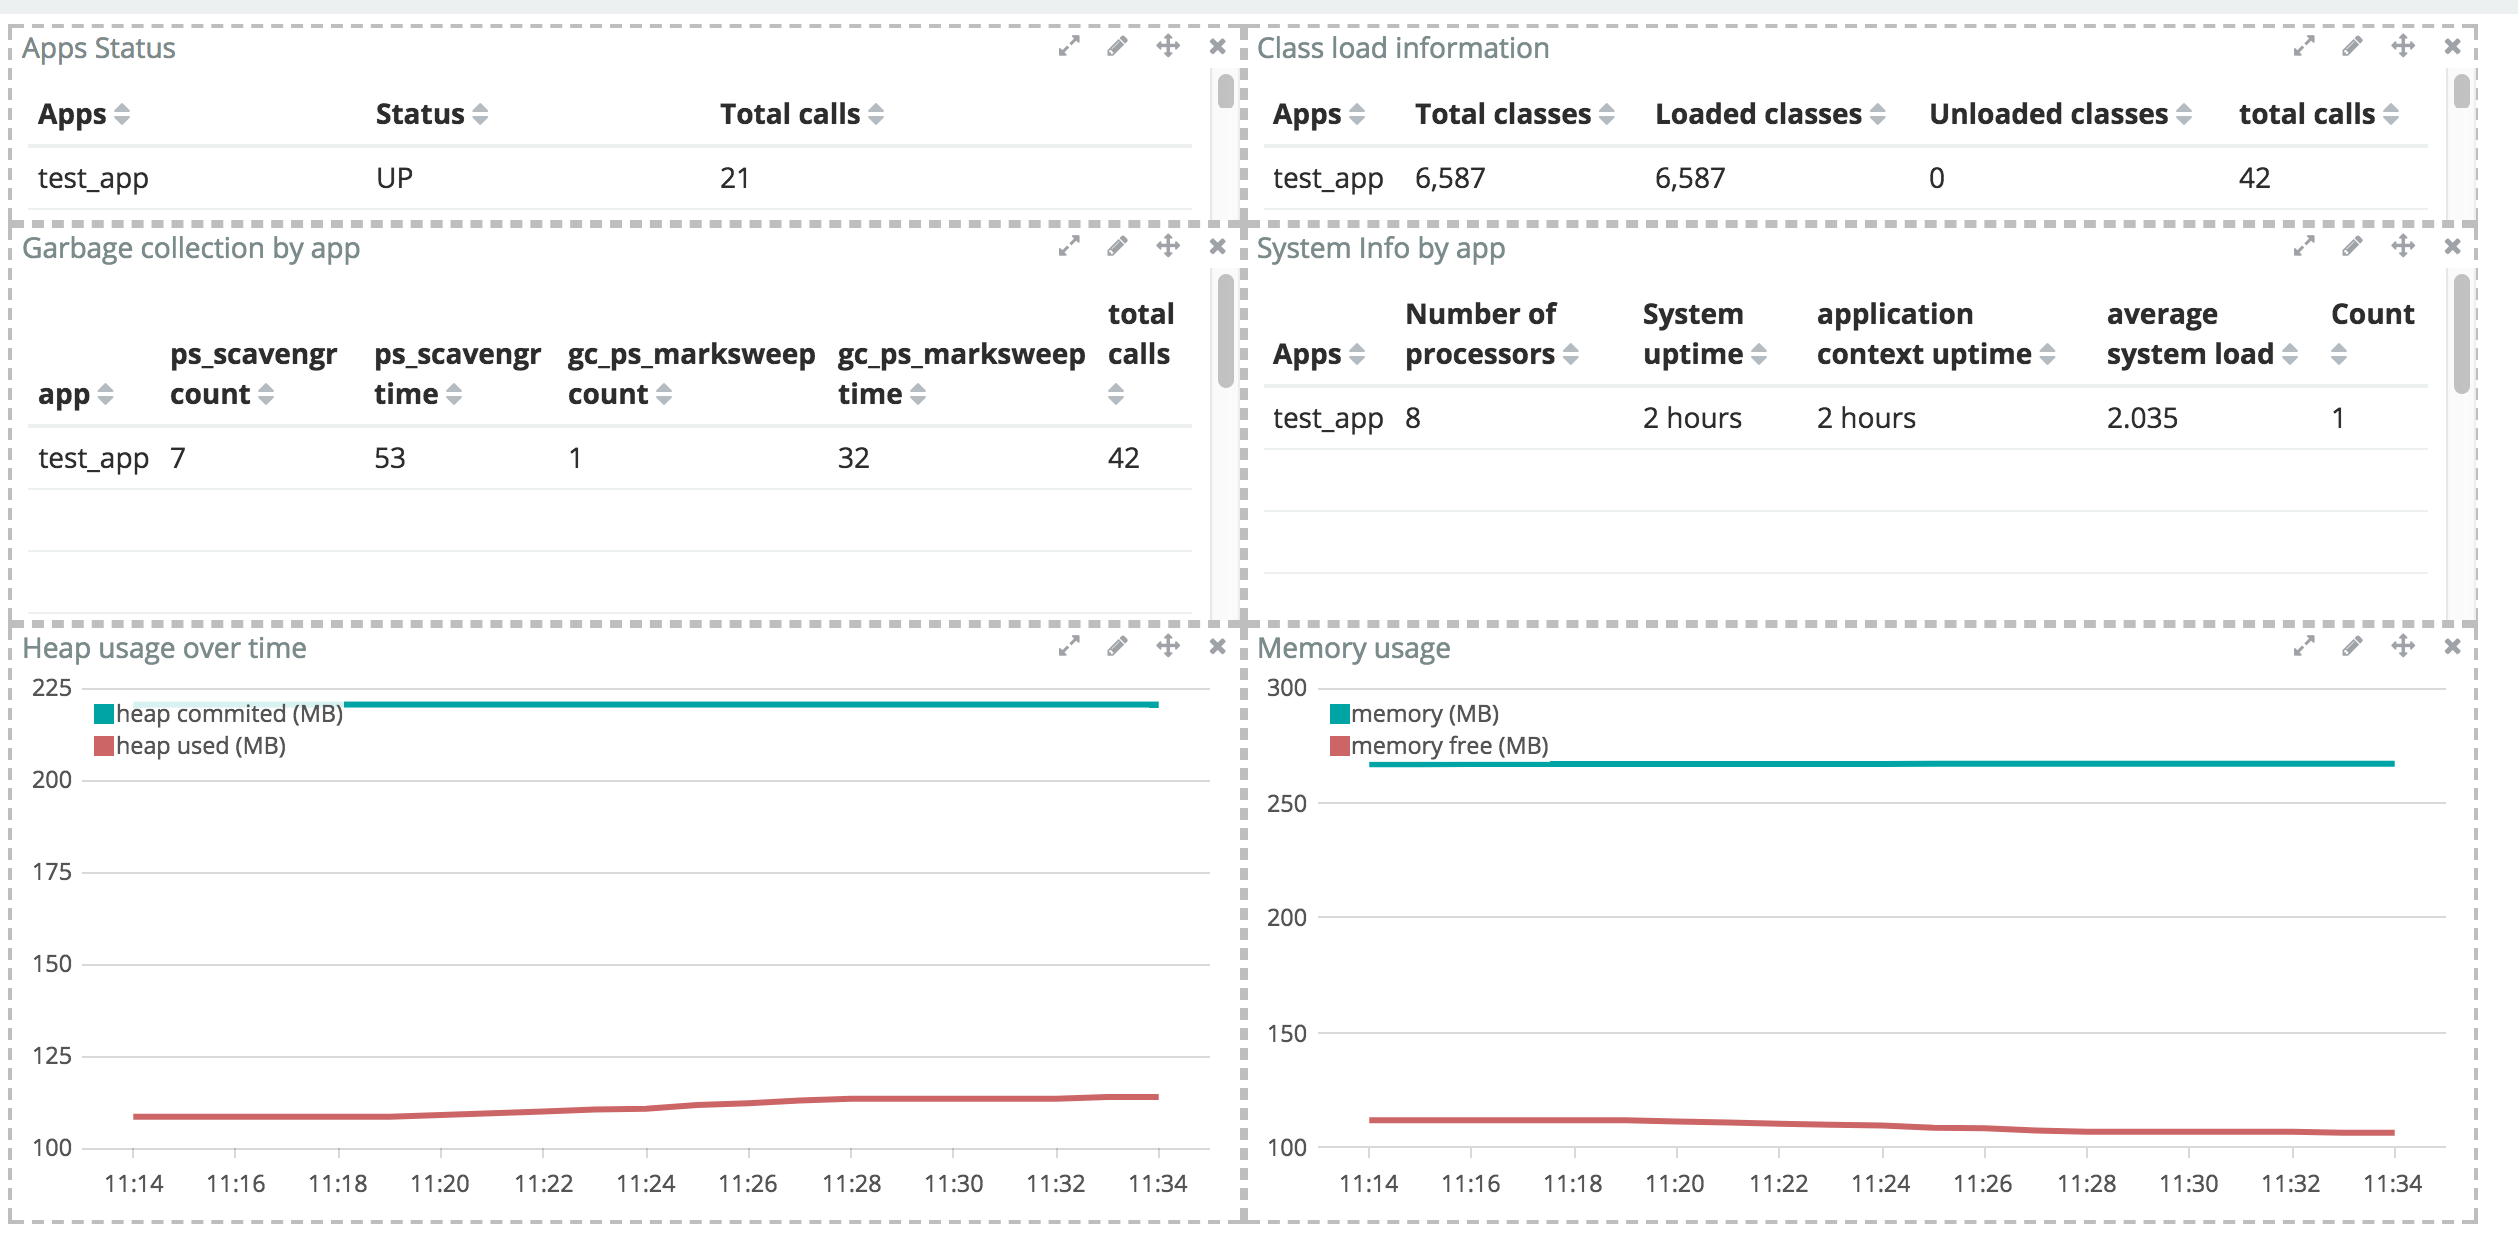
Kibana dashboard
Now that we've our index created, we should [add it to kibana] (https://www.elastic.co/guide/en/kibana/current/tutorial-define-index.html) and start playing with it.