Docker Monitoring with the ELK Stack
Docker is growing by leaps and bounds, and along with it its ecosystem. Being light, the predominant container deployment involves running just a single app or service inside each container. Most software products and services are made up of at least several such apps/services. We all want all our apps/services to be highly available and fault tolerant. Thus, Docker containers in an organization quickly start popping up like mushrooms after the rain. They multiply faster than rabbits. While in the beginning we play with them like cute little pets, as their number quickly grow we realize we are dealing with aherd of cattle, implying we’ve become cowboys. Managing a herd with your two hands, a horse, and a lasso willget you only so far. You won’t be able to ride after each and every calf that wonders in the wrong direction.
Container orchestration helps you manage your containers, their placement, their resources, and their whole life cycle. While containers and applications in them are running, in addition to the whole life cycle management we need container monitoring and log management so we can troubleshoot performance or stability issues, debug or tune applications, and so on. Just like with orchestration, there are a number of open-source container monitoring and logging tools. My preferred one so far is the ELK Stack, and in this article, we'll see how easy to setup an ELK stack, to monitor your container based infrastructure. The complete source code of this example can be found here.
The ELK Stack is a collection of three open-source products: Elasticsearch, Logstash, and Kibana. Elasticsearch is a NoSQL database that is based on the Lucene search engine. Logstash is a log pipeline tool that accepts inputs from various sources, executes different transformations, and exports the data to various targets. Kibana is a visualization layer that works on top of Elasticsearch.
Filebeat is an application that quickly ships data directly to either Logstash or Elasticsearch. Filebeat also needs to be used because it helps to distribute loads from single servers by separating where logs are generated from where they are processed. Consequently, Filebeat helps to reduce CPU overhead by using prospectors to locate log files in specified paths, leveraging harvesters to read each log file, and sending new content to a spooler that combines and sends out the data to an output that you have configured.
Elasticsearch Image
The Elasticsearch image is built on top of openjdk official docker image. As you've noticed, I'm using java 8 in this example. The rest of the command will download from the Elasticsearch website, unpack, configure the permissions for the Elasticsearch folder, and then start Elasticsearch.
Before you start to create the Dockerfile, we should create an elasticsearch.yml file:
cluster.name: docker-morocco-example
node.name: docker-node-1
path.data: /home/esuser/data
network.host: "0.0.0.0"
and the The Dockerfile for the Elasticsearch image should look like this:
FROM openjdk:8

MAINTAINER Aboullaite Mohammed
ENV DEBIAN_FRONTEND noninteractive

ENV ELASTICSEARCH_VERSION 5.2.1
# Add esuser to avoid starting Elasticsearch as the root user.
RUN useradd -d /home/esuser -m esuser
WORKDIR /home/esuser

RUN mkdir /data

# Install Elastisearch
RUN \
wget https://artifacts.elastic.co/downloads/elasticsearch/elasticsearch-${ELASTICSEARCH_VERSION}.tar.gz && \
tar xvzf elasticsearch-${ELASTICSEARCH_VERSION}.tar.gz && \
rm -f elasticsearch-${ELASTICSEARCH_VERSION}.tar.gz && \
chown -R esuser:esuser elasticsearch-${ELASTICSEARCH_VERSION}

 # elasticsearch.yml and Dockerfile are on same location
ADD elasticsearch.yml /home/esuser/elasticsearch-${ELASTICSEARCH_VERSION}/config/elasticsearch.yml
ENTRYPOINT elasticsearch-${ELASTICSEARCH_VERSION}/bin/elasticsearch
Logstash Image
Logstash image creation is similar to Elasticsearch image creation, but the steps in creating a Dockerfile vary. In this article, I will show you how to configure a Docker container that uses NGINX installed on a Linux OS to track the NGINX and Linux logs and ship them out. This means that you will have to configure Logstash to receive these logs and then pass them onto Elasticsearch.
As mentioned above, we are using Filebeat first to isolate where logs are generated from, where they are processed and then to ship the data quickly. So, we need to use Filebeat to send logs from their points of origin (NGINX, Apache, MySQL, Redis ...) to Logstash for processing.
We use Beats input plugin (this is a platform that lets us build customized data shippers for Elasticsearch) to configure Logstash, which will listen on port 5000:
    # Use a Beats input plugin
    input {
      beats {
        port => 5000
      }
    }
The output is easy to guess. we want Elasticsearch to store our logs, so the Logstash output configuration will be this:
# We want Elasticsearch to store our logs
    output {
      elasticsearch {
        hosts => ["elasticsearch:9200"]
      }
    }
Do not be confused by the elasticsearch:9200 inside hosts and whether Logstash will know the IP address for elasticsearch. The answers will be clear when you start to execute the Docker instances.
The complex part of this configuration is the filtering. You want to log NGINX and Linux logs. Filebeat will monitor access.log and error.log files for NGINX and syslogfiles for Linux logs. I will explain how Filebeat monitors these files below.
The final filter configuration is this:
# parsing nginx logs with logstachhere
    filter {
      if [type] == "nginx-access" {
      grok {
      match => [ "message" , "%{COMBINEDAPACHELOG}+%{GREEDYDATA:extra_fields}"]
      overwrite => [ "message" ]
    }

      mutate {
        convert => ["response", "integer"]
        convert => ["bytes", "integer"]
        convert => ["responsetime", "float"]
      }

      geoip {
        source => "clientip"
        target => "geoip"
        add_tag => [ "nginx-geoip" ]
      }

      date {
        match => [ "timestamp" , "dd/MMM/YYYY:HH:mm:ss Z" ]
        remove_field => [ "timestamp" ]
      }

      useragent {
        source => "agent"
      }
      } else if [type] == "nginx-error"{
        grok {
          match => [ "message", "(?<timestamp>\d{4}/\d{2}/\d{2} \d{2}:\d{2}:\d{2}) \[%{DATA:nginx_severity}\] %{NOTSPACE} %{NOTSPACE} (?<nginx_message>(.|\r|\n)*)(?:, client: (?<nginx_client_ip>%{IP}|%{HOSTNAME}))(?:, server: %{IPORHOST:nginx_server})(?:, request: %{QS:nginx_request})?(?:, host: %{QS:nginx_host})?(?:, referrer: %{URI:nginx_referrer})?"]
          #"message" , "(?%{YEAR}[./-]%{MONTHNUM}[./-]%{MONTHDAY}[- ]%{TIME}) \[%{LOGLEVEL:severity}\] %{POSINT:pid}#%{NUMBER}: %{GREEDYDATA:errormessage}(?:, client: (?%{IP}|%{HOSTNAME}))(?:, server: (%{IPORHOST:server})?)(?:, request: %{QS:request})?(?:, upstream: \"%{URI:upstream}\")?(?:, host: %{QS:host})?(?:, referrer: \"%{URI:referrer}\")?"]
          overwrite => [ "message" ]
        }
        geoip {
          source => "client"
          target => "geoip"
          add_tag => [ "nginx-geoip" ]
        }

        date {
          match => [ "timestamp" , "YYYY/MM/dd HH:mm:ss" ]
          remove_field => [ "timestamp" ]
        }
        } else if [type] ==  "syslog" {
          grok {
            match => { "message" => "%{SYSLOGLINE}" }
            overwrite => [ "message" ]
          }
        }
      }
The Dockerfile for the Logstash image is this:
  FROM openjdk:8

  MAINTAINER Aboullaite Mohammed
  ENV DEBIAN_FRONTEND noninteractive

  ENV LOGSTASH_VERSION 5.2.1
  # Add lsuser to avoid starting logstash as the root user.
  RUN useradd -d /home/lsuser -m lsuser
  WORKDIR /home/lsuser

  # Install logstash
  RUN \
  wget https://artifacts.elastic.co/downloads/logstash/logstash-${LOGSTASH_VERSION}.tar.gz && \
  tar xvzf logstash-${LOGSTASH_VERSION}.tar.gz && \
  rm -f logstash-${LOGSTASH_VERSION}.tar.gz && \
  chown -R lsuser:lsuser logstash-${LOGSTASH_VERSION}


  # logstash.conf and Dockerfile are on same location
  ADD logstash.conf /home/lsuser
  CMD logstash-${LOGSTASH_VERSION}/bin/logstash -f logstash.conf --verbose
Kibana Configuration
Well, you know how it works now. we start by setting up a kibana configuration file that looks like this:
    server.port: 5601
    server.host: "0.0.0.0"
    elasticsearch.url: "http://elasticsearch:9200"
And the complete Docker file is:
    FROM openjdk:8

    MAINTAINER Aboullaite Mohammed
    ENV DEBIAN_FRONTEND noninteractive

    ENV KIBANA_VERSION 5.2.1
    # Add kbuser to avoid starting Kibana as the root user.
    RUN useradd -d /home/kbuser -m kbuser
    WORKDIR /home/kbuser

    # Install Kibana
    RUN \
    wget https://artifacts.elastic.co/downloads/kibana/kibana-${KIBANA_VERSION}-linux-x86_64.tar.gz && \
    tar xvzf kibana-${KIBANA_VERSION}-linux-x86_64.tar.gz && \
    rm -f kibana-${KIBANA_VERSION}-linux-x86_64.tar.gz && \
    chown -R kbuser:kbuser kibana-${KIBANA_VERSION}-linux-x86_64

    # Kibana.yml and Dockerfile are on same location
    ADD kibana.yml kibana-${KIBANA_VERSION}-linux-x86_64/config/kibana.yml
    ENTRYPOINT kibana-${KIBANA_VERSION}-linux-x86_64/bin/kibana
Creating an NGINX Image
The missing pieces to the puzzle is NGIN (in a Linux OS) that will generate NGINX logs together with Linux logs. Filebeat will then collect and ship the logs to Logstash.
Let's start by configuring Filebeat:
    filebeat:
      prospectors:
        -
          paths:
            - /var/log/syslog
            - /var/log/auth.log
          document_type: syslog
        -
          paths:
            - "/var/log/nginx/access.log"
          document_type: nginx-access
        -
          paths:
            - "/var/log/nginx/error.log"
          document_type: nginx-error

    output:
     logstash:
        enabled: true
        hosts:
          - logstash:5000
        timeout: 15
The ELK image includes configuration items (/etc/logstash/conf.d/11-nginx.conf and /opt/logstash/patterns/nginx) to parse nginx access logs, as forwarded by the Filebeat instance above.
The docker file download and install filebeat above nginx image, add a dummy HTML file and specify an entrypoint:
    FROM nginx
    MAINTAINER Aboullaite Mohammed
    ENV DEBIAN_FRONTEND noninteractive

    ### install Filebeat

    ENV FILEBEAT_VERSION 5.2.1

    RUN apt-get update -qq \
     && apt-get install -qqy curl \
     && apt-get clean

    RUN curl -L -O https://artifacts.elastic.co/downloads/beats/filebeat/filebeat-${FILEBEAT_VERSION}-amd64.deb \
     && dpkg -i filebeat-${FILEBEAT_VERSION}-amd64.deb \
     && rm filebeat-${FILEBEAT_VERSION}-amd64.deb


    ###############################################################################
    #                                CONFIGURATION
    ###############################################################################

    ### tweak nginx image set-up

    # remove log symlinks
    RUN rm /var/log/nginx/access.log /var/log/nginx/error.log


    ### configure Filebeat

    # config file
    ADD filebeat.yml /etc/filebeat/filebeat.yml

    ###############################################################################
    #                                    DATA
    ###############################################################################

    ### add dummy HTML file

    COPY html /usr/share/nginx/html

    ###############################################################################
    #                                    START
    ###############################################################################

    ADD ./start.sh /usr/local/bin/start.sh
    RUN chmod +x /usr/local/bin/start.sh
    CMD [ "/usr/local/bin/start.sh" ]
The entrypoint is simply a script that load the default index template in Elasticsearch, start filebeat and nginx:
    #!/bin/bash

    curl -XPUT 'http://elasticsearch:9200/_template/filebeat?pretty' -d@/etc/filebeat/filebeat.template.json
    /etc/init.d/filebeat start
    nginx
    tail -f /var/log/nginx/access.log -f /var/log/nginx/error.log
All together
The very final step is to run the docker-compose file using docker-compose up:
  version: '2'

  services:
    elasticsearch:
      build: elasticsearch/
      ports:
        - "9200:9200"
        - "9300:9300"
      environment:
        ES_JAVA_OPTS: "-Xms1g -Xmx1g"
      user: esuser
      networks:
        - docker_elk
    logstash:
      build: logstash/
      ports:
        - "5000:5000"
      user: lsuser
      networks:
        - docker_elk
      depends_on:
        - elasticsearch
    kibana:
      build: kibana/
      ports:
        - "5601:5601"
      user: kbuser
      networks:
        - docker_elk
      depends_on:
        - elasticsearch
    nginx:
      build: nginx/
      ports:
        - "8080:80"
      networks:
        - docker_elk
      depends_on:
        - logstash

  networks:
    docker_elk:
      driver: bridge
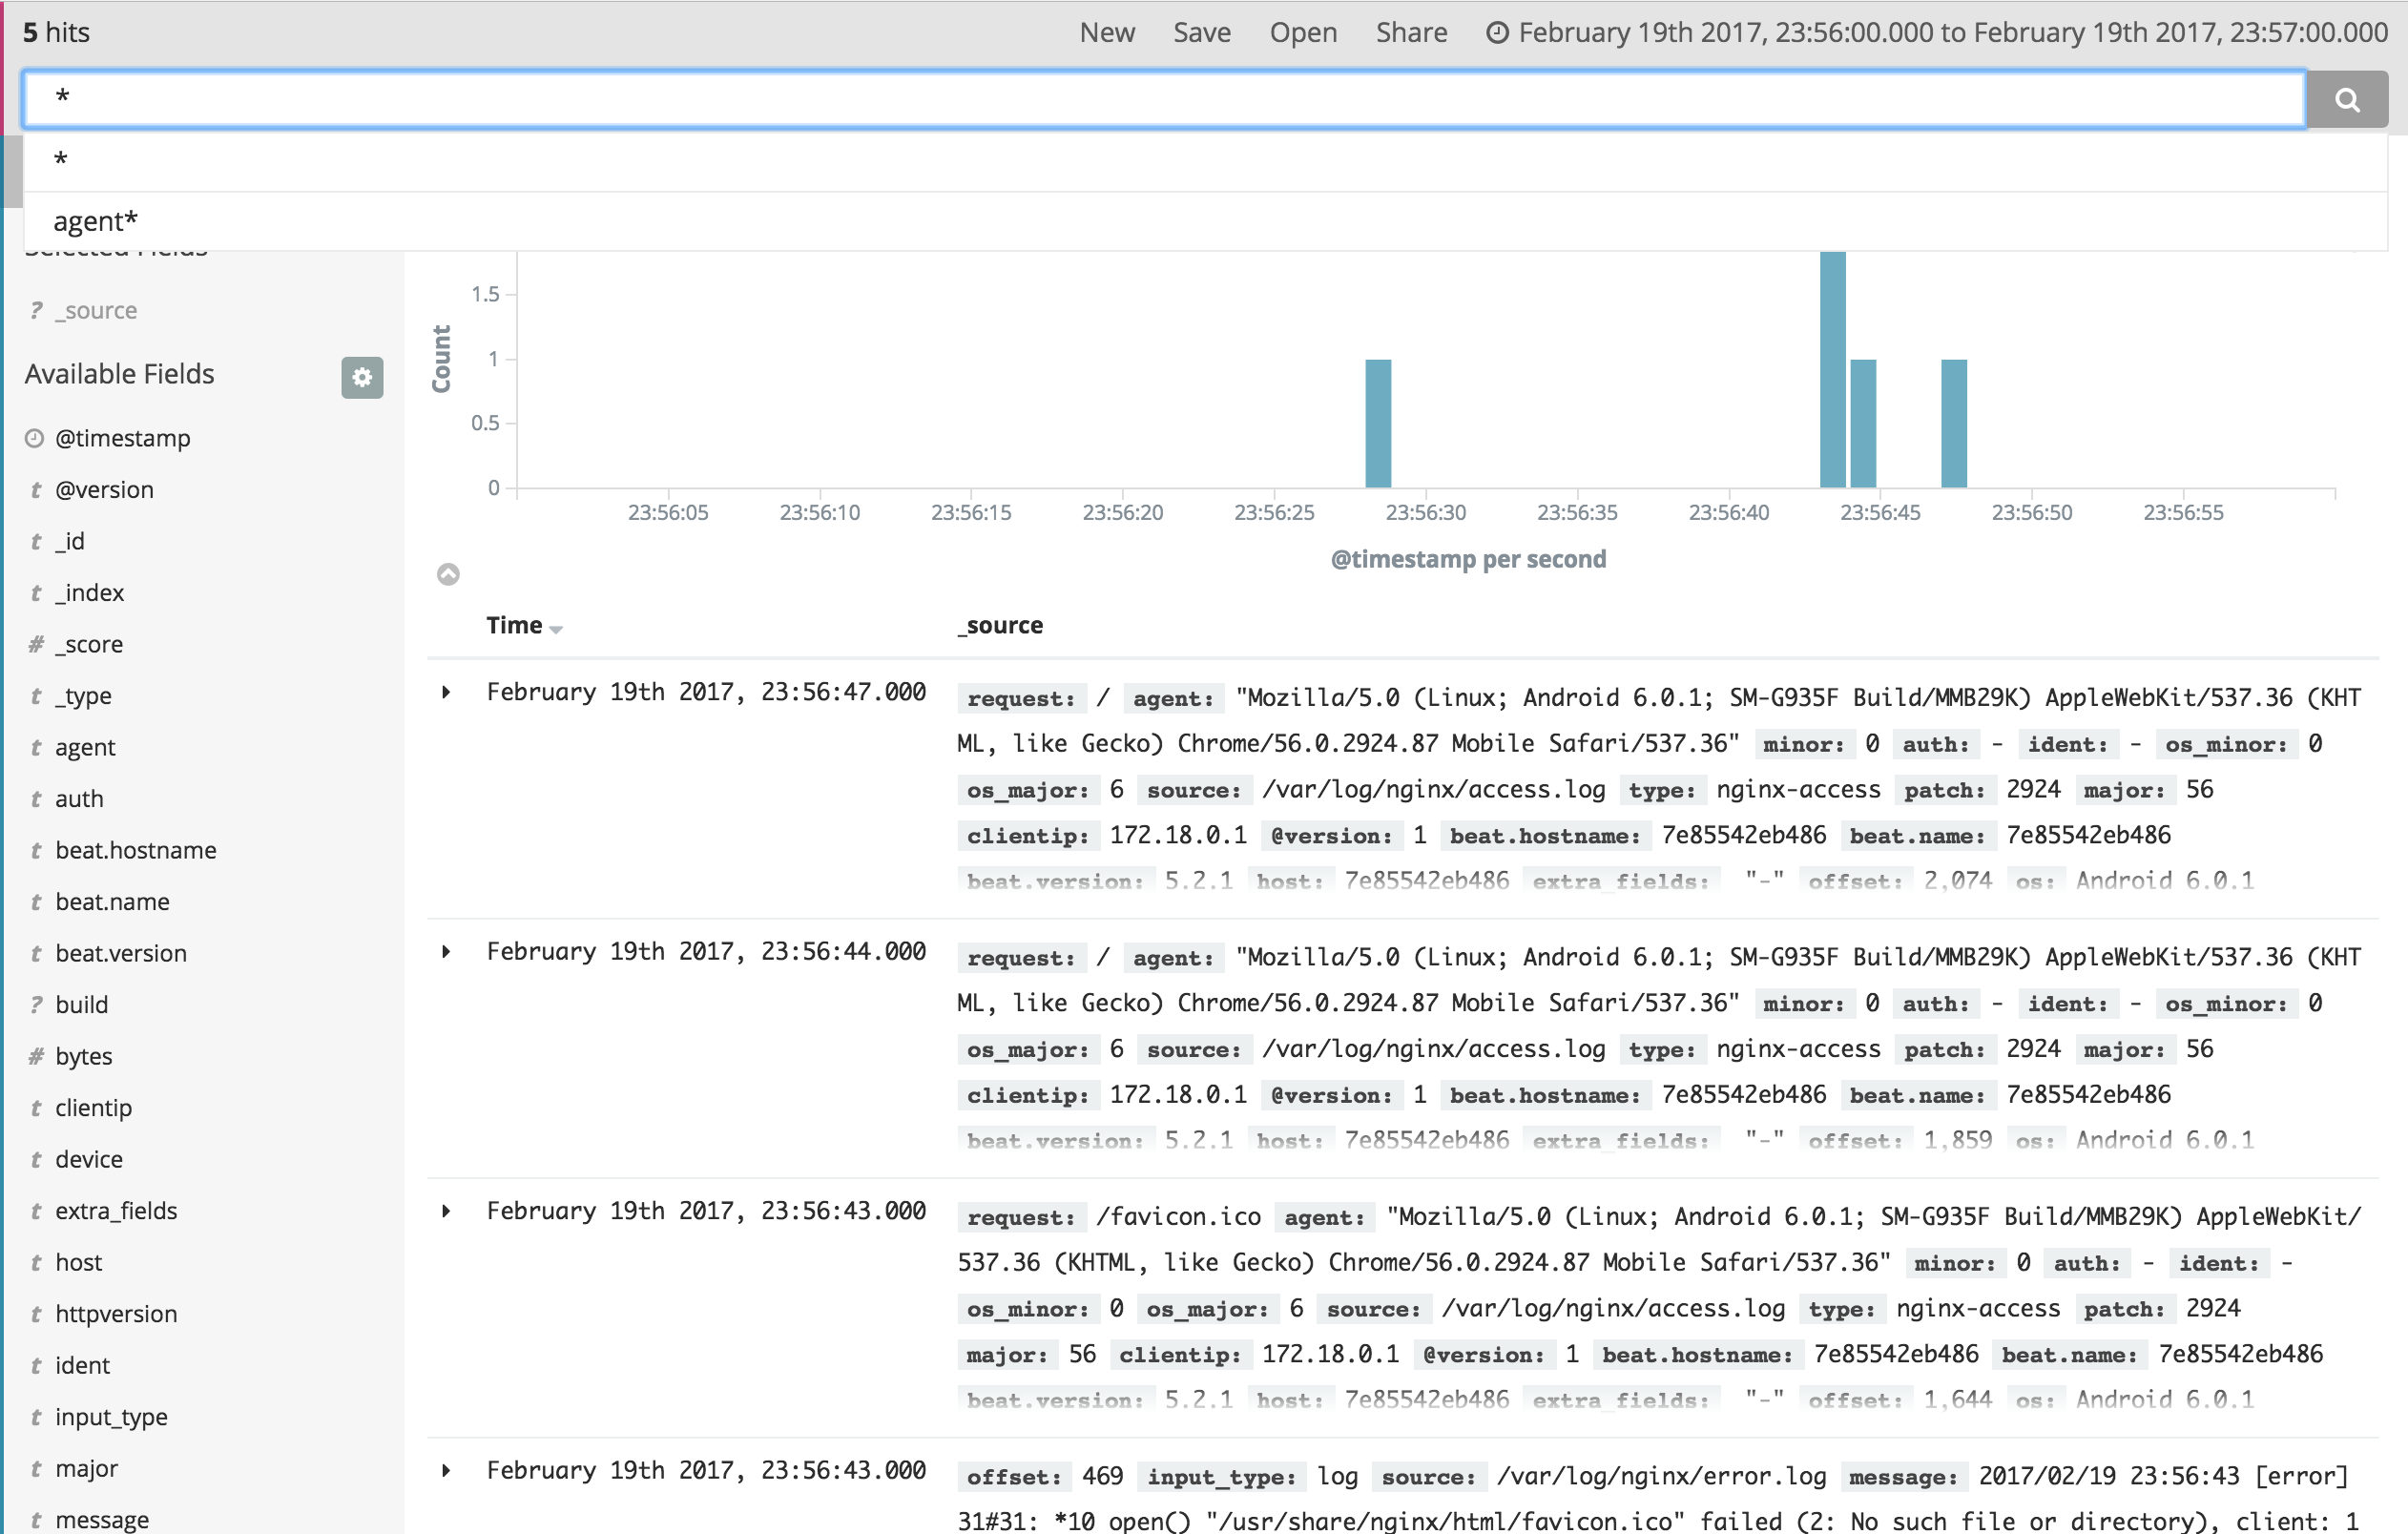
Wait until all set up. go to localhost:8080 to genrate some logs from nginx, then check them using localhost:5601. You should have something like this:
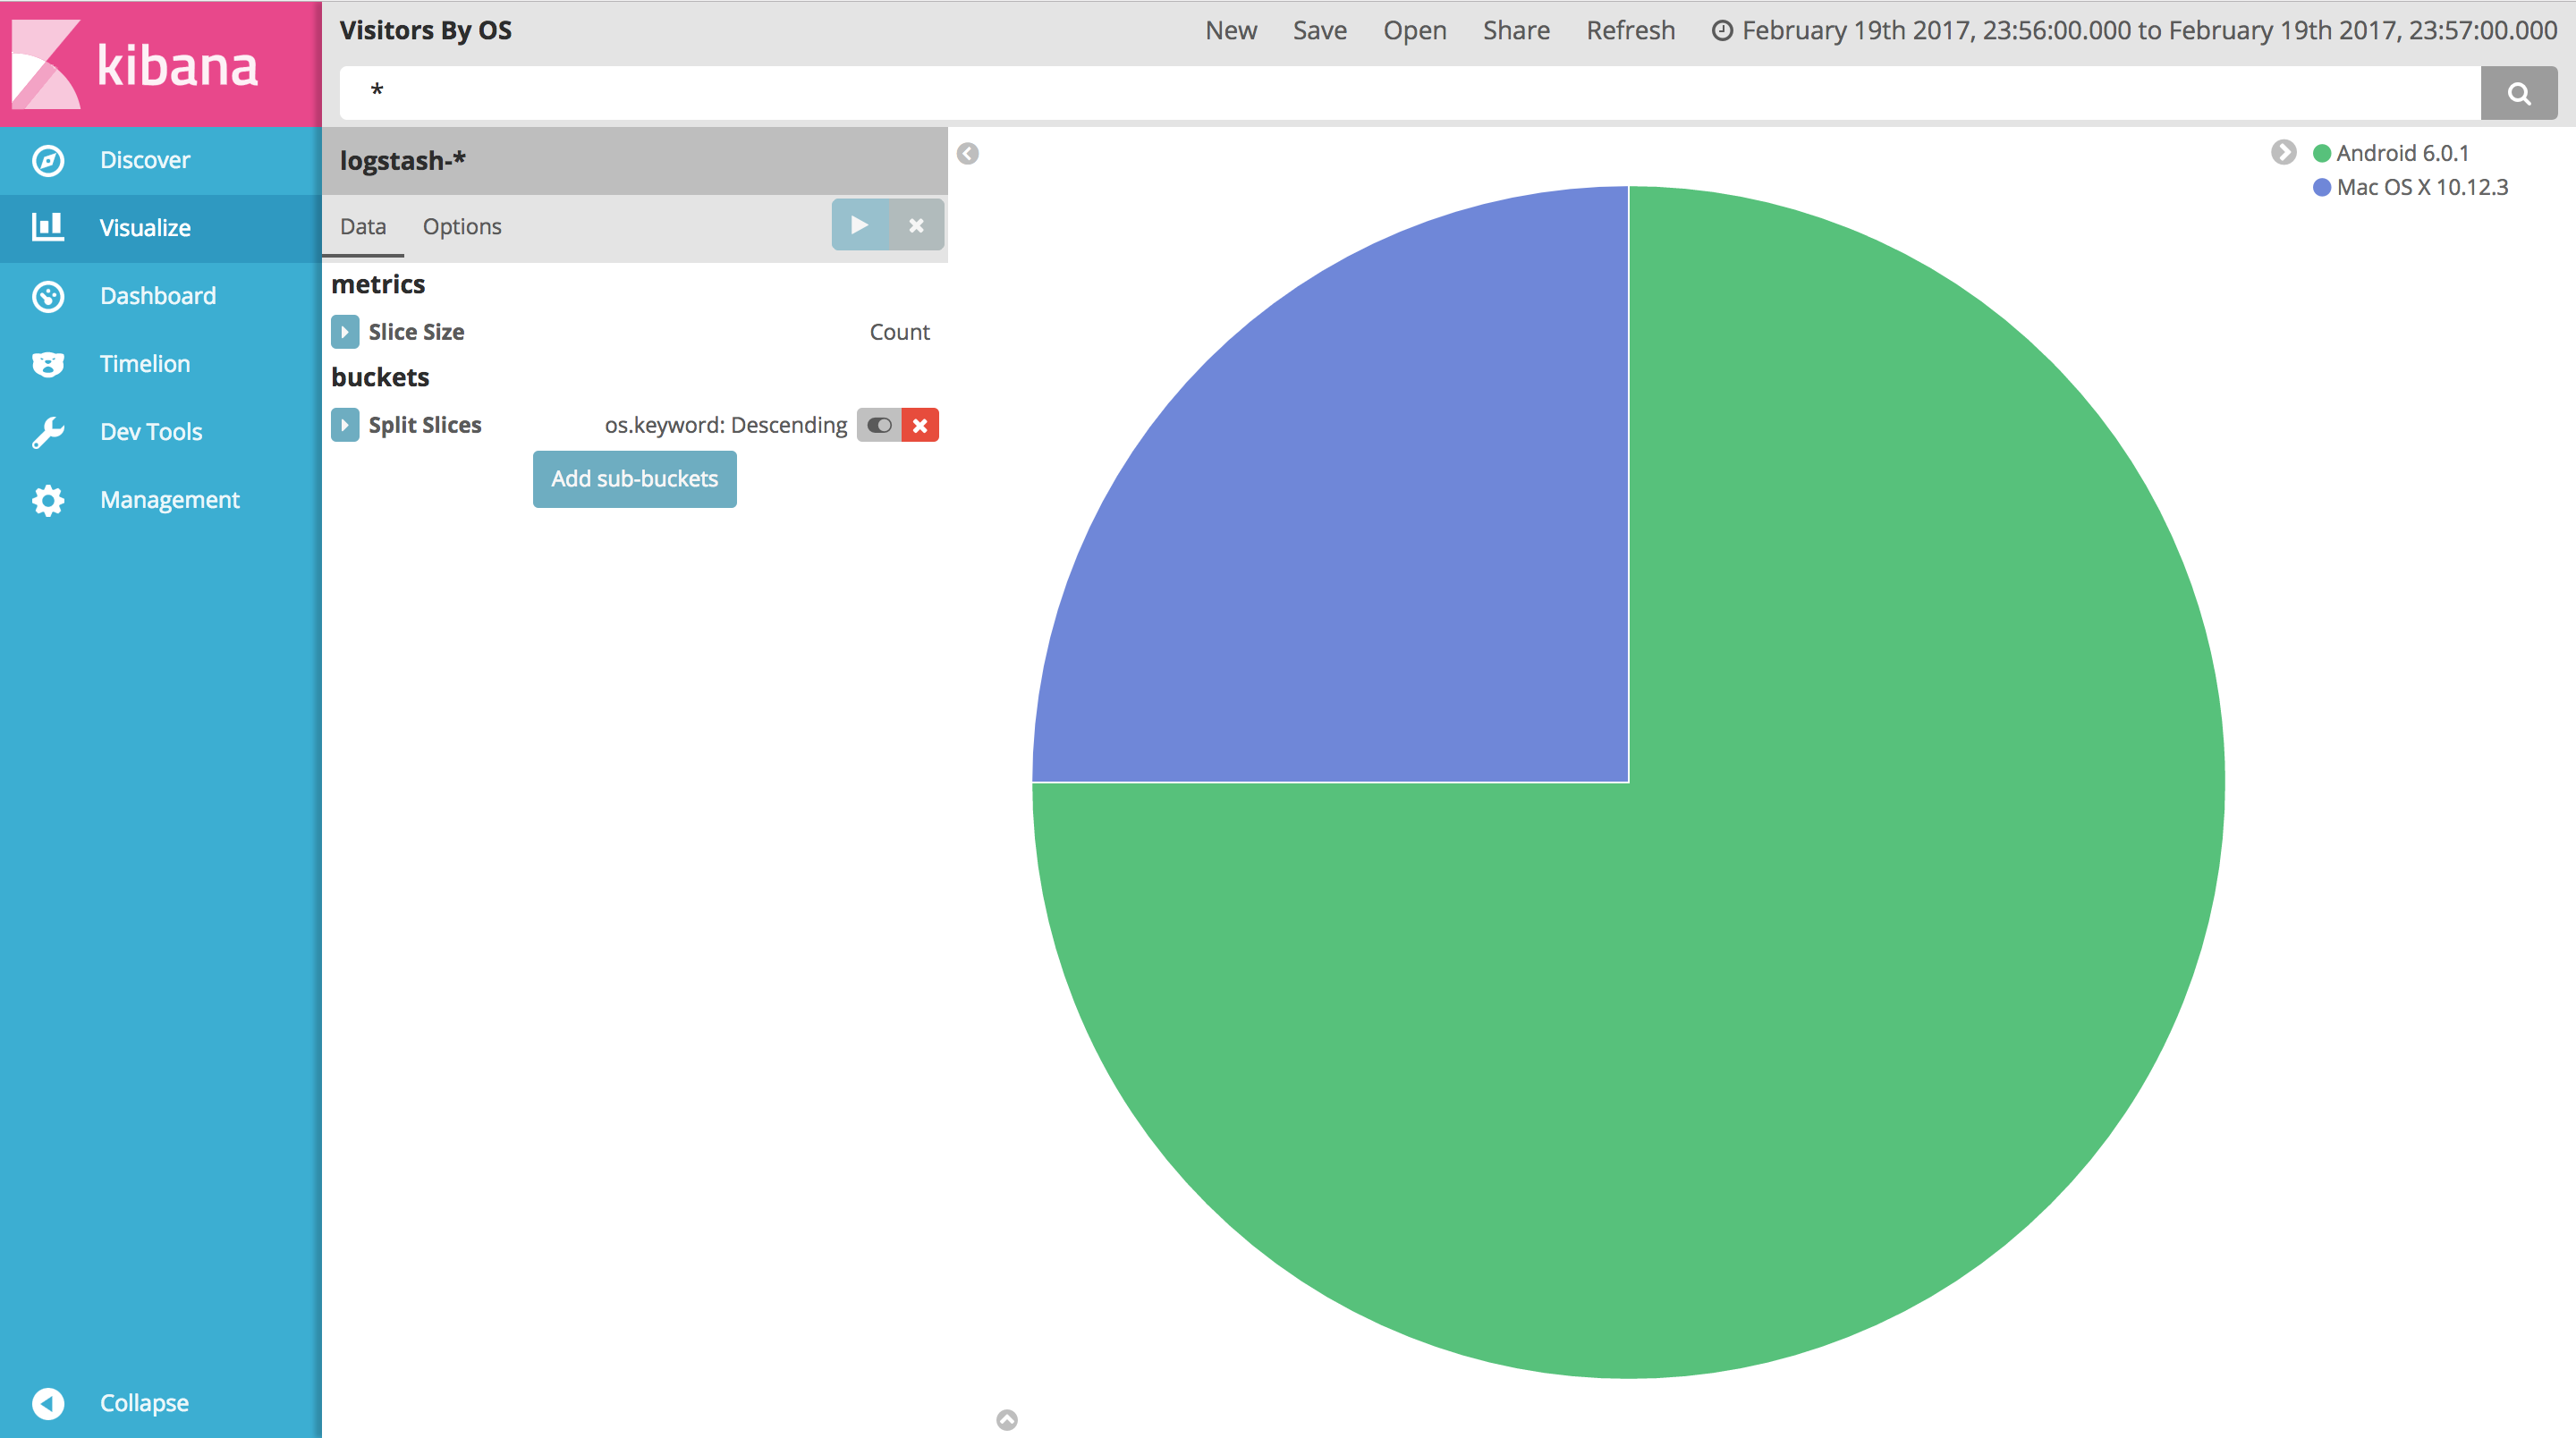
You can even create a few charts on Kibana’s Visualize page and collect them in a customized dashboard.