In this era of rapid changes and fast deployment, where microservices grow like mushrooms to answer the growing users needs and features, keeping a close eye on your mission critical applications and ensuring they're running optimally at all time becomes more and more important!
A variety of tools exist, both open source and commercial enabling runtime and health metrics collection, evaluating application performance and generating alerts when needed.
Since it's first versions, Spring boot included additional features to help monitor and manage application when its pushed to production. With the release of version 2, Actuator got a new boost with many new features and updates. Based on Micrometer, this new version provides a simple facade over the instrumentation clients for the most popular monitoring systems, allowing to instrument the application code without vendor lock-in.
In this post, we'll see how we can easily monitor Spring boot applications using KairosDB and grafana. Let's dig in!
KairosDB
KairosDB is a is a fast and open source time series database built atop Cassandra. Data is sent to KairosDB via multiple protocols such as Rest, and Graphite. It provides a rich set of features such as Rest API, an intuitive web interface to run queries against the database backend, aggregators, native client libraries and plugin architecture for extensibility. KairosDB can scale to over 10 billion data points per day.
KairosDB, Cassandra & Grafana
KairosDB provides a detailed guide to install and configure KairosDB & Cassandra (or other datastores!). Another quick and easy way to set up our stack is obviously using Docker! The below docker-compose file configures the 3 services: KairosDB, Cassandra and Grafana.
version: "3.7"

networks:
  cass_net:
    driver: bridge

services:
  grafana:
    image: grafana/grafana:5.4.3
    entrypoint: /bin/sh
    command: ["-c", "grafana-cli plugins install grafana-kairosdb-datasource && /run.sh"]
    logging:
      driver: json-file
      options:
        max-size: "10m"
        max-file: "1"
    restart: always
    ports:
      - "3000:3000"
    networks:
      - cass_net
    environment:
      - GF_SECURITY_ADMIN_PASSWORD=secret

  kairosdb:
    image: elastisys/kairosdb:1.2.1
    logging:
      driver: json-file
      options:
        max-size: "10m"
        max-file: "1"
    restart: always
    ports:
      - "8080:8080"
    networks:
      - cass_net
    environment:
      - CASSANDRA_HOSTS=cassandra
      - CASSANDRA_PORT=9042

  cassandra:
    image: cassandra:3.11
    logging:
      driver: json-file
      options:
        max-size: "10m"
        max-file: "1"
    restart: always
    ports:
      - "9042:9042"
    volumes:
      - ${PWD}/cassandra-data:/var/lib/cassandra
    networks:
      - cass_net
    environment:
      - CASSANDRA_CLUSTER_NAME=test-cluster
Running docker-compose up will spin up the 3 services, KairosDB HTTP data API as well as a Web UI are both exposed via port 8080, while grafana is reachable at port 3000.
Spring boot Configuration
Micrometer is now the default metrics library in Spring Boot 2. Besides collecting and shipping metrics from your Spring application, it also delivers JVM metrics (garbage collection and memory pools, etc) as well as metrics from the application container! Micrometer has several different registries that can be included to ship metrics to different tools, like KairosDB in our case.
First off, we should add actuator and micrometer's kairos registry dependencies to our pom:
        <dependency>
            <groupId>org.springframework.boot</groupId>
            <artifactId>spring-boot-starter-actuator</artifactId>
        </dependency>

        <dependency>
            <groupId>io.micrometer</groupId>
            <artifactId>micrometer-registry-kairos</artifactId>
            <version>${kairos-registry-version}</version>
        </dependency>
Under the hood, Spring Boot auto configures the composite MeterRegistry and adds KairosDB registry to the composite (and for each of the supported implementations that it finds on the classpath).
Additionally, we need to enable metrics export to Kairos and specify its location in the application.yml config file:
management:
  metrics:
    export:
      kairos:
        enabled: true
        uri: http://localhost:8080/api/v1/datapoints
Time for visualisations
KairosDB comes with a query page whereby you can query data within the datastore. The UI is designed primarily for development purposes. you can build your query, add aggregators, inspect query in JSON box and load Graphs.
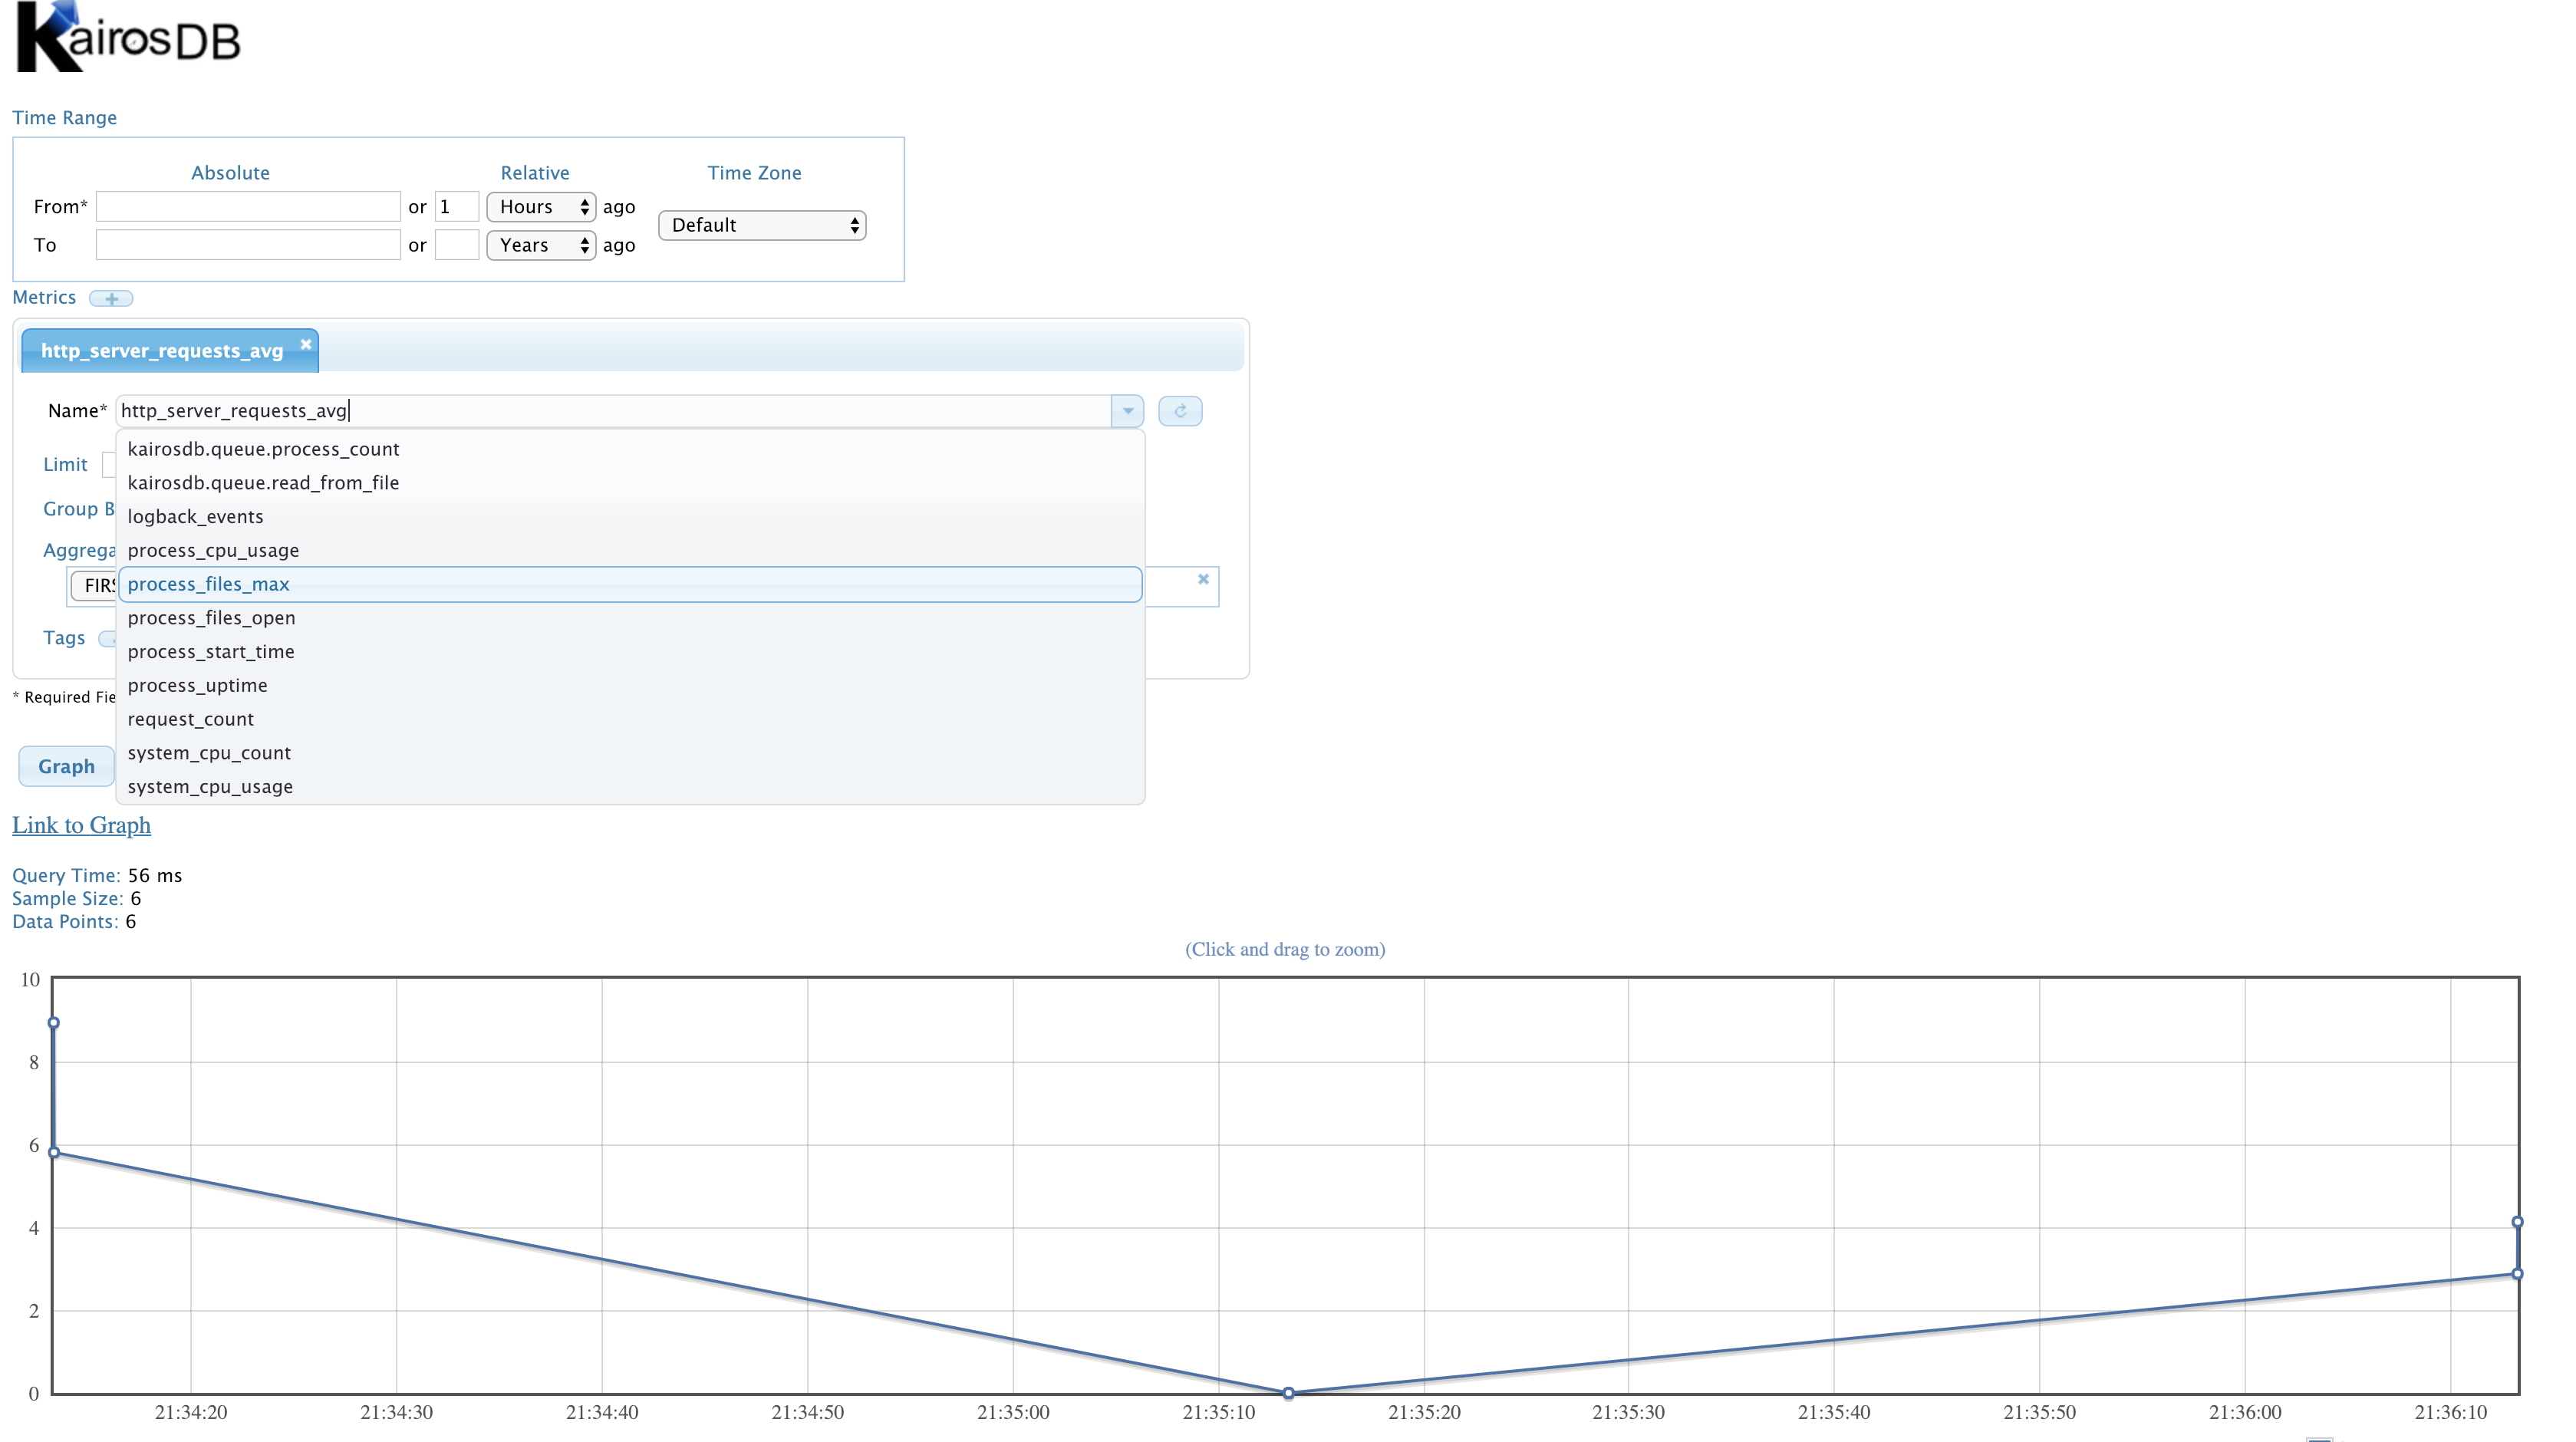
KairosDB UI isn’t going to win any design awards, but it still functional and great for debugging during development. In contrast, for production dashboards, We'd use one of the other dashboarding tools that support KairosDB such as Grafana.
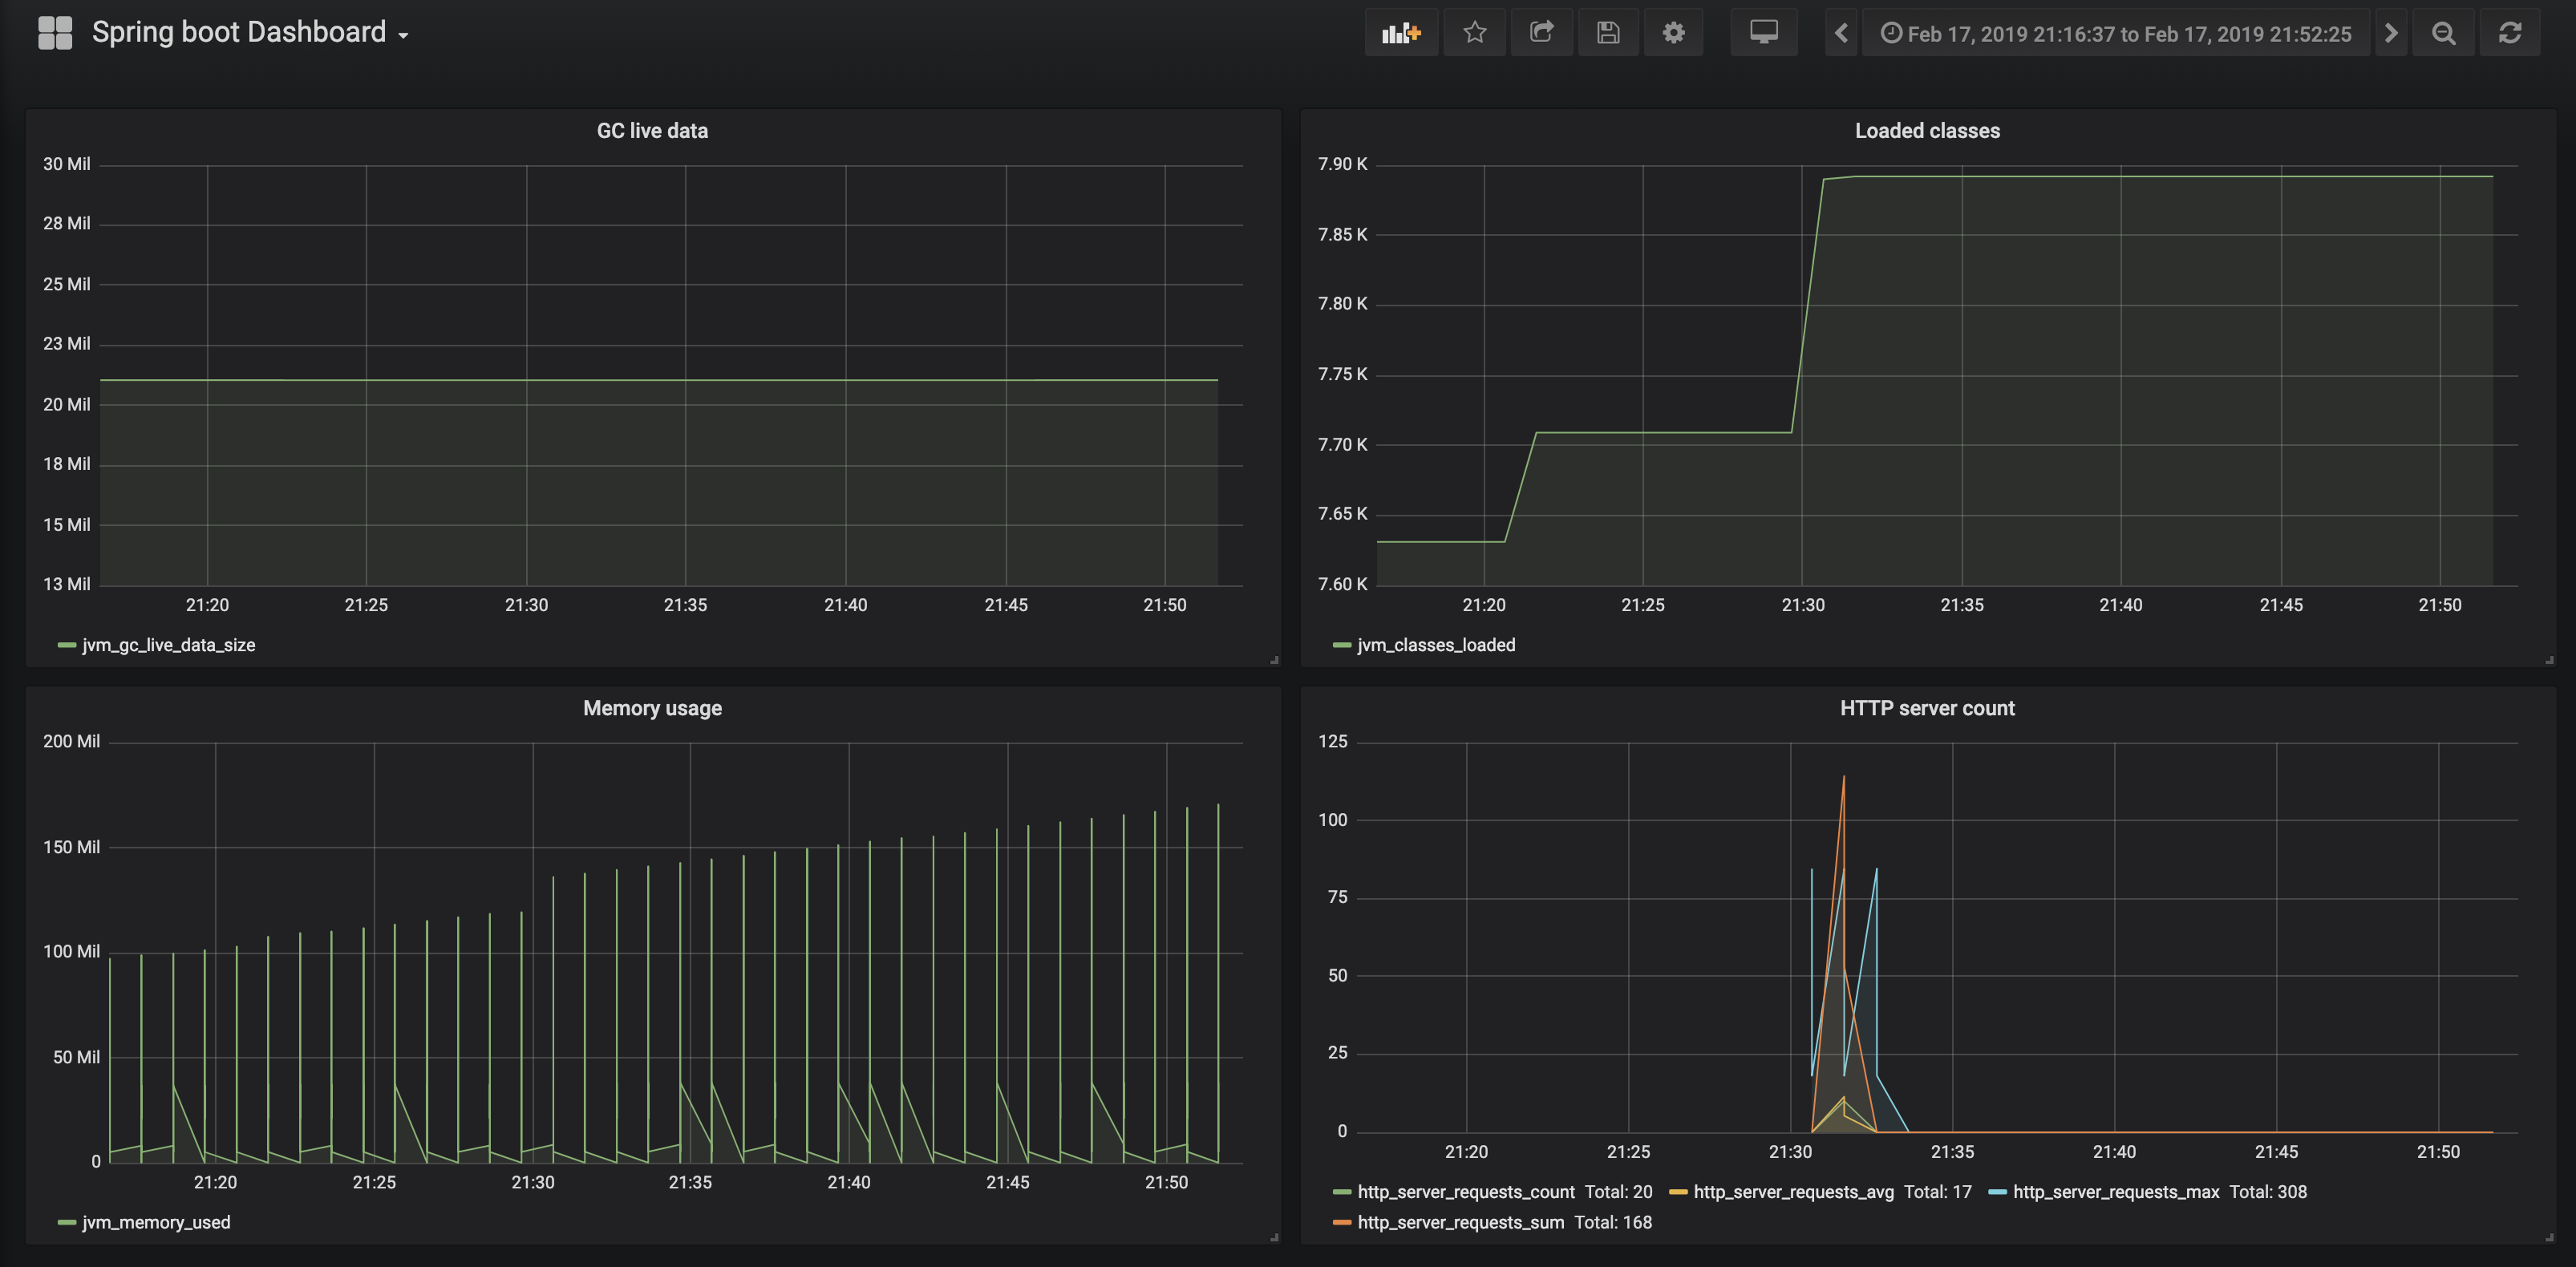
The first step is to connect Grafana to KairosDB as a backend, which is supported since v2.1. Once completed we're good to go and start building some super cool dashboards and visualisations. Below an example: