
We finally got first drop of snow this week in Stockholm. The eather is getting colder and days shorter. That only motivates me to continue writing my third and final post in the RAG series.
In part one, we explored the production challenges of RAG systems. In part two, we dove deep into the architecture and component design. Now let's talk about the elephant in the room: why Kubernetes?
The LLM Infrastructure Problem
LLM applications have unique operational requirements that traditional web applications don't face:
1. GPU Resource Management
Running models like Gemma-2-2B requires GPUs. Not just any GPUs—specific GPU types (L4, A100, H100) with minimum VRAM requirements. You need:
- Dynamic allocation: Spin up GPU nodes when needed, tear down when idle
- Multi-tenancy: Share expensive GPUs across multiple services (when possible)
- Isolation: Ensure one model's OOM crash doesn't kill other workloads
- Scheduling: Route inference requests to GPU-backed pods automatically
Kubernetes thicks all the boxes.
2. Heterogeneous Scaling
Our RAG pipeline has components with radically different scaling profiles:
| Component | Scaling Trigger | Resource Type | Scale Range |
|---|---|---|---|
| Retriever | CPU + Request rate | CPU-intensive | 2-30 replicas |
| Orchestrator | Connection count | I/O-bound | 2-10 replicas |
| LLM (KServe) | Inference load | GPU-bound | 0-3 replicas (scale-to-zero) |
| Vector DB | Query volume | Memory + I/O | Managed/external |
| Cache (Redis) | Memory usage | Memory-bound | 1 replica (stateful) |
Each component needs independent scaling logic. The retriever might scale out to 30 replicas during a traffic spike while the orchestrator stays at 2 replicas. The LLM should scale to zero when idle (saving $$$ on GPU costs) but warm up quickly when requests arrive.
Kubernetes HPA, KEDA, and KServe give you fine-grained control over each layer.
3. Network Complexity
Our RAG pipelines involve complex service-to-service communication:
- Orchestrator → Retriever (HTTP)
- Retriever → Weaviate (gRPC)
- Retriever → OpenSearch (REST)
- Orchestrator → KServe (HTTP with streaming)
- Orchestrator → Redis (TCP)
- All services → OTEL Collector (gRPC)
- All services → Prometheus (HTTP scraping)
We need:
- Service discovery (how does the orchestrator find the retriever?)
- Load balancing (distribute requests across retriever replicas)
- Retry logic (retry failed requests with backoff)
- Circuit breaking (stop calling unhealthy services)
- Observability (trace requests across service boundaries)
Kubernetes Services, Ingress, and service meshes (Istio, Linkerd) handle this out of the box.
4. Deployment Complexity
Production deployments require:
- Canary releases: Route 10% of traffic to new versions, monitor metrics, rollback if needed
- Blue-green deployments: Swap entire environments atomically
- Rolling updates: Replace pods gradually without downtime
- Rollback: Revert to previous versions quickly
- Health checks: Readiness and liveness probes to avoid routing to broken pods
- Resource limits: Prevent resource exhaustion and noisy neighbor problems
Kubernetes Deployments, StatefulSets, and Rollouts (via Argo) provide these primitives.
5. Observability at Scale
When you have 30 retriever pods, 10 orchestrator pods, and multiple LLM replicas, you need:
- Distributed tracing: See request flows across services
- Metrics aggregation: Scrape metrics from all pods automatically
- Log aggregation: Centralized logging with correlation IDs
- Dashboarding: Real-time visibility into system health
Kubernetes + Prometheus + OpenTelemetry + Grafana + Tempo is the standard stack.
Why Not Serverless?
Serverless functions (Lambda, Cloud Functions, Cloud Run) work for stateless HTTP APIs. But LLM workloads break the serverless model:
Cold starts: LLMs take 10-60 seconds to load into GPU memory. Cold starts are unacceptable.
Execution time limits: Serverless has timeouts (AWS Lambda: 15 minutes, Cloud Functions: 60 minutes). Long-running inference or batch processing exceeds these limits.
GPU support: Limited or expensive. AWS Lambda doesn't support GPUs. Cloud Run supports GPUs but at premium pricing without scale-to-zero.
Stateful caching: Semantic caching requires shared state (Redis). Serverless architectures push state to external services, adding latency.
Cost: Serverless pricing is optimized for bursty, short-lived workloads. LLM inference is compute-intensive and benefits from sustained usage discounts on VMs/GPUs.
All of those arguments can be mitigated. But Kubernetes gives us serverless-like abstractions (KServe scale-to-zero) while maintaining control over GPU resources, state management, and cost.
The Kubernetes Deployment Strategy
Let's walk through deploying this RAG system to Kubernetes, both locally (KinD) and in production (GKE).
Production Deployment on GKE
Google Kubernetes Engine (GKE) provides managed Kubernetes with:
- Autopilot mode: Google manages nodes, scaling, security patches
- GPU node pools: L4, A100, H100 GPU support
- Regional clusters: High availability across zones
- Integrated logging: Stackdriver integration
- VPC-native networking: Secure service-to-service communication
Creating the cluster:
# Configure environment
vim .env  # Set GCP_PROJECT, GKE_REGION, REGISTRY

# Create GKE cluster
make gke-cluster
This provisions:
- Node pool: 3 nodes,
e2-standard-4(4 vCPU, 16GB RAM) - Autopilot: Optional (use
make gke-autopilotfor fully managed) - Region:
europe-west4(Belgium, low latency to EU users) - Network: VPC-native with private IPs
Installing KServe:
KServe requires manual installation (for now). Run these commands:
# Install cert-manager
kubectl apply -f https://github.com/cert-manager/cert-manager/releases/download/v1.13.0/cert-manager.yaml
kubectl wait --for=condition=available --timeout=300s deployment/cert-manager-webhook -n cert-manager

# Install Knative Serving
kubectl apply -f https://github.com/knative/serving/releases/download/knative-v1.20.0/serving-crds.yaml
kubectl apply -f https://github.com/knative/serving/releases/download/knative-v1.20.0/serving-core.yaml

# Install Kourier networking layer
kubectl apply -f https://github.com/knative/net-kourier/releases/download/knative-v1.20.0/kourier.yaml
kubectl patch configmap/config-network \
  --namespace knative-serving \
  --type merge \
  --patch '{"data":{"ingress-class":"kourier.ingress.networking.knative.dev"}}'

# Install KServe
kubectl apply -f https://github.com/kserve/kserve/releases/download/v0.16.0/kserve.yaml
kubectl wait --for=condition=available --timeout=300s deployment/kserve-controller-manager -n kserve
kubectl apply -f https://github.com/kserve/kserve/releases/download/v0.16.0/kserve-cluster-resources.yaml

# Configure raw deployment mode (no Knative autoscaling)
kubectl patch configmap/inferenceservice-config -n kserve --type merge \
  --patch '{"data":{"deploy":"{\"defaultDeploymentMode\":\"RawDeployment\"}"}}'
Create GPU node pool:
make gke-gpu
This creates a separate node pool with:
- GPU type: NVIDIA L4 (24GB VRAM, cost-effective for inference)
- Machine type:
g2-standard-4(4 vCPU, 16GB RAM, 1x L4 GPU) - Nodes: 1 node (autoscales 0-3 based on demand)
- Taints:
nvidia.com/gpu=present:NoSchedule(only GPU workloads land here)
Deploy the stack:
# Build and push images to Artifact Registry
gcloud auth configure-docker europe-north1-docker.pkg.dev
make build

# Deploy all services + LoadBalancer
make gke-deploy

# Ingest sample data
make ingest

# Get external IP
kubectl get svc orchestrator-public -n rag
Your production RAG system is now live at http://<EXTERNAL_IP>.
Autoscaling
Autoscaling is where Kubernetes shines. Let's break down each layer.
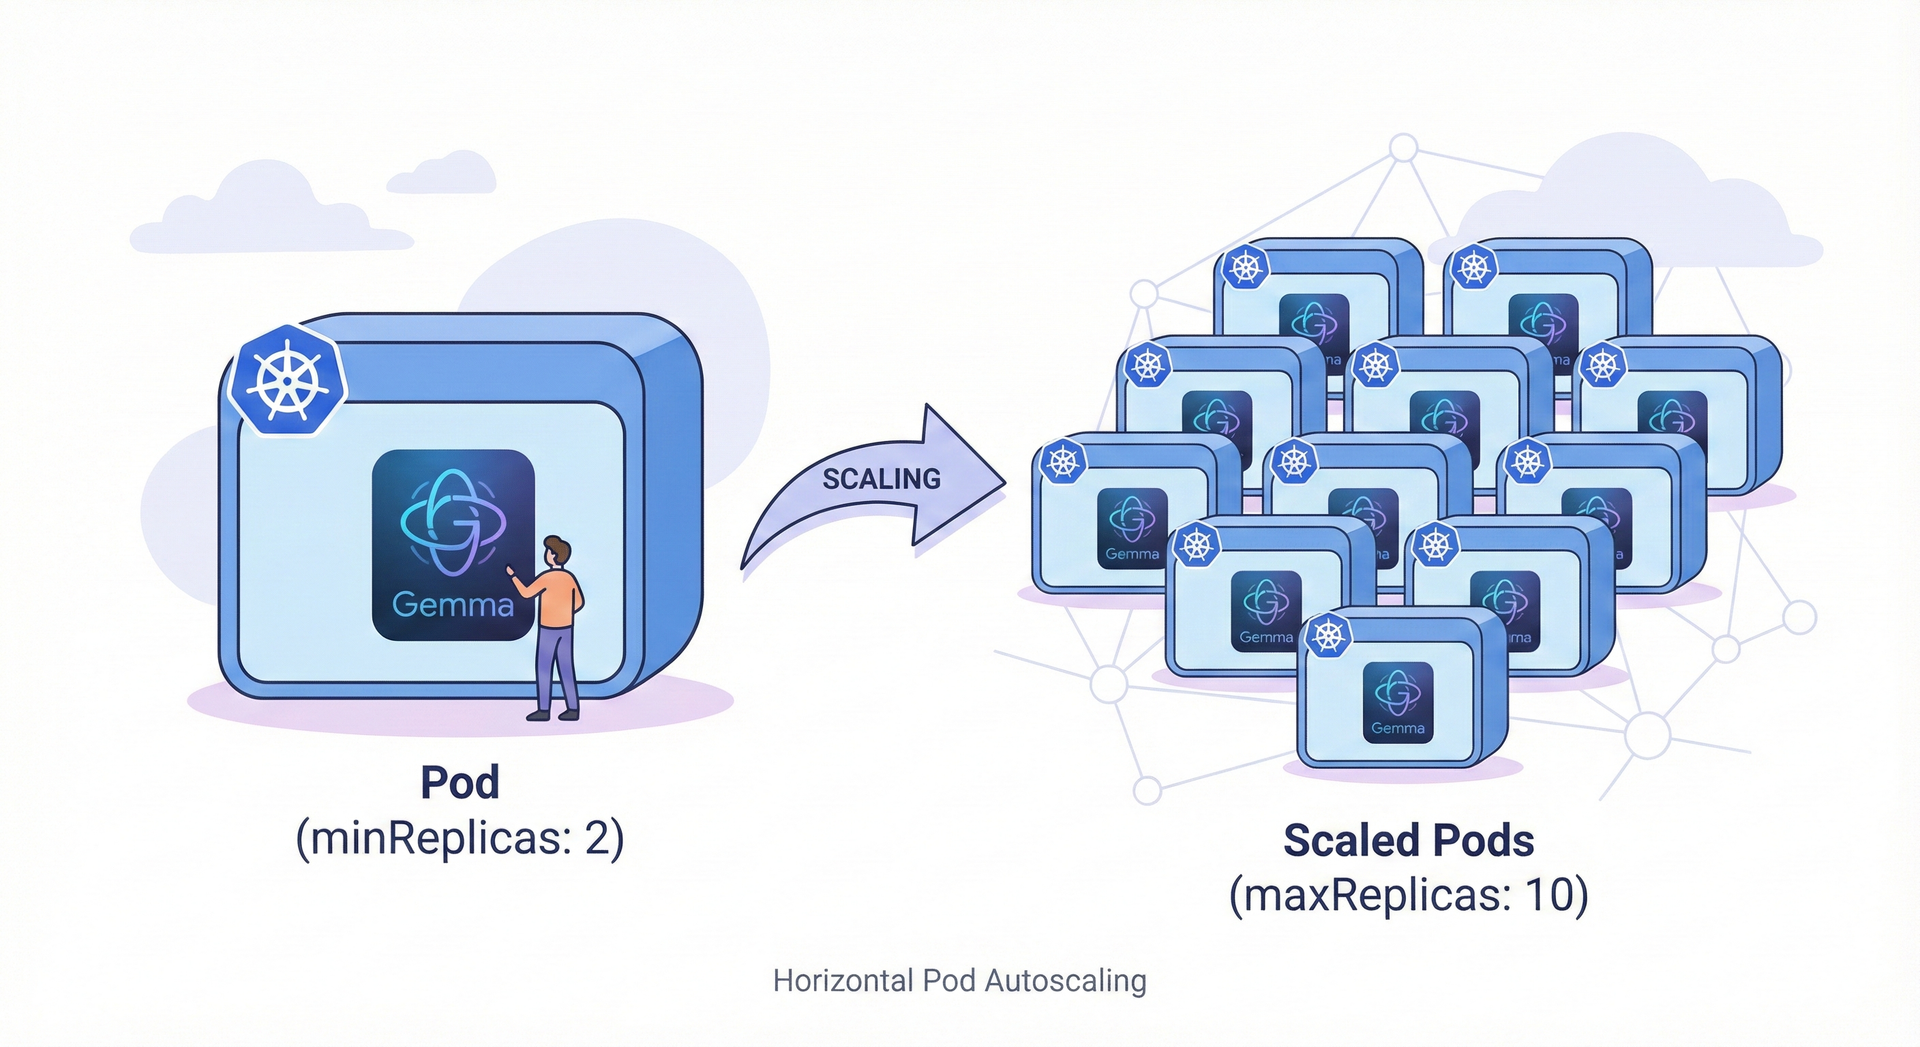
Horizontal Pod Autoscaler (HPA): CPU-Based Scaling
HPA scales pods based on resource metrics (CPU, memory). For the retriever service:
# deploy/hpa-retriever.yaml

apiVersion: autoscaling/v2
kind: HorizontalPodAutoscaler
metadata:
  name: retriever-hpa
  namespace: rag
spec:
  scaleTargetRef:
    apiVersion: apps/v1
    kind: Deployment
    name: retriever
  minReplicas: 2
  maxReplicas: 30
  metrics:
    - type: Resource
      resource:
        name: cpu
        target:
          type: Utilization
          averageUtilization: 70
  behavior:
    scaleDown:
      stabilizationWindowSeconds: 300
      policies:
        - type: Percent
          value: 50
          periodSeconds: 60
    scaleUp:
      stabilizationWindowSeconds: 0
      policies:
        - type: Percent
          value: 100
          periodSeconds: 30
        - type: Pods
          value: 4
          periodSeconds: 30
      selectPolicy: Max
How it works:
- HPA queries Kubernetes Metrics Server for pod CPU usage
- If average CPU > 70%, scale up
- If average CPU < 70%, scale down (after stabilization window)
- Scale-up is aggressive (100% increase or +4 pods, whichever is greater)
- Scale-down is gradual (50% decrease every 60 seconds, after 5-minute stabilization)
Why these settings?
- minReplicas: 2: Ensures redundancy (if one pod crashes, traffic routes to the other)
- maxReplicas: 30: Handles extreme traffic spikes without unbounded cost
- averageUtilization: 70: Headroom for bursts without constant scaling oscillation
- scaleUp aggressive, scaleDown gradual: Prefer over-provisioning during spikes, slow drain during cooldowns
KEDA: Event-Driven Autoscaling
HPA is great for CPU/memory scaling, but what about custom metrics? Enter KEDA (Kubernetes Event-Driven Autoscaling).
KEDA scales based on external metrics like:
- Prometheus queries
- Kafka message lag
- AWS SQS queue depth
- Custom HTTP endpoints
For the retriever, we scale based on requests per second:
# deploy/keda-retriever.yaml

apiVersion: keda.sh/v1alpha1
kind: ScaledObject
metadata:
  name: retriever-keda
  namespace: rag
spec:
  scaleTargetRef:
    name: retriever
  minReplicaCount: 2
  maxReplicaCount: 30
  cooldownPeriod: 120
  triggers:
    - type: prometheus
      metadata:
        serverAddress: http://prometheus.observability.svc.cluster.local:9090
        query: |
          sum(rate(http_server_requests_seconds_count{app="retriever",namespace="rag"}[1m]))
        threshold: "15"
How it works:
- KEDA queries Prometheus every 30 seconds
- Executes the PromQL query:
sum(rate(http_server_requests_seconds_count{app="retriever"}[1m])) - If total RPS > 15 requests/sec, scale up by 1 replica
- If total RPS < 15 requests/sec, scale down by 1 replica (after 120-second cooldown)
Why RPS-based scaling?
CPU utilization is a lagging indicator. By the time CPU hits 70%, users are already experiencing latency. RPS is a leading indicator—traffic increases before CPU saturates.
With 15 RPS threshold:
- 2 replicas handle 30 RPS
- 10 replicas handle 150 RPS
- 30 replicas handle 450 RPS
In load testing, this scales the retriever from 2→20 replicas within 90 seconds when traffic ramps from 10→200 RPS.
KServe: Scale-to-Zero for LLMs
GPU costs are expensive. Leaving an L4 GPU idle costs ~$0.60/hour (~$430/month). Scale-to-zero is critical.
KServe (via Knative Serving) provides:
- Scale to zero: Terminate pods when idle for 60 seconds
- Warm-up on demand: Spin up pods on first request
- Concurrency-based scaling: Scale based on in-flight requests
# deploy/kserve-vllm.yaml

apiVersion: serving.kserve.io/v1beta1
kind: InferenceService
metadata:
  name: rag-llm
  namespace: rag
spec:
  predictor:
    minReplicas: 0        # Scale to zero when idle
    maxReplicas: 3        # GPU instance
    scaleTarget: 20        # Target 20 concurrent request
    scaleMetric: concurrency
    model:
      runtime: vllm-runtime
      modelFormat:
        name: huggingface
      args:
        - --model
        - google/gemma-2-2b-it
        - --dtype
        - auto
        - --max-model-len
        - "4096"
      resources:
        limits:
          nvidia.com/gpu: 1
          cpu: "3"
          memory: 12Gi
Cold start latency:
- Model download: ~10-20 seconds (cached after first run)
- Model load to GPU: ~15-30 seconds
- First inference: ~1-3 seconds
- Total cold start: ~30-50 seconds
Mitigation strategies:
- Keep-alive: Background service pings the model every 45 seconds to prevent scale-down
- Fallback: Orchestrator uses deterministic fallback during cold starts
- Pre-warming: Scale to 1 replica before traffic spikes (e.g., before scheduled events)
For production workloads with consistent traffic, set minReplicas: 1 to avoid cold starts.
Combining HPA + KEDA + KServe
Why use both HPA and KEDA for the retriever?
They complement each other:
- HPA: Reacts to CPU saturation (protects against resource exhaustion)
- KEDA: Reacts to request rate (proactive scaling before CPU saturates)
Kubernetes merges their recommendations, choosing the higher replica count. During traffic spikes:
- KEDA detects rising RPS and scales to 3 replicas
- CPU usage remains <70% (HPA doesn't trigger)
- If CPU spikes above 70% (e.g., slow queries), HPA overrides and scales to 15 replicas
- When traffic drops, KEDA scales down after cooldown
This multi-signal approach prevents both under-provisioning (latency spikes) and over-provisioning (wasted cost).
Observability Stack: Seeing What's Happening
You can't optimize what you can't measure. The observability stack provides end-to-end visibility.
Architecture Overview

OpenTelemetry Tracing
Every request generates a distributed trace spanning multiple services. The OpenTelemetry Java agent instruments Spring Boot automatically:
# deploy/retriever.yaml

initContainers:
  - name: otel-agent-downloader
    image: busybox:1.36
    command:
      - sh
      - -c
      - >
        wget -q -O /otel/javaagent.jar
        https://github.com/open-telemetry/opentelemetry-java-instrumentation/releases/download/v2.21.0/opentelemetry-javaagent.jar
    volumeMounts:
      - name: otel-agent
        mountPath: /otel

containers:
  - name: retriever
    env:
      - name: OTEL_EXPORTER_OTLP_ENDPOINT
        value: http://otel-collector.observability.svc.cluster.local:4317
      - name: JAVA_TOOL_OPTIONS
        value: "-javaagent:/otel/javaagent.jar"
    volumeMounts:
      - name: otel-agent
        mountPath: /otel
Custom span attributes provide RAG-specific context:
// common/src/main/java/me/aboullaite/rag/common/tracing/TracingUtils.java

public class TracingUtils {
    public static void recordCacheHit(Span span, boolean hit) {
        span.setAttribute("rag.cache.hit", hit);
    }

    public static void recordRetrievedDocs(Span span, List<RetrievedDoc> docs) {
        span.setAttribute("rag.retrieval.count", docs.size());
        if (!docs.isEmpty()) {
            span.setAttribute("rag.retrieval.source",
                docs.get(0).metadata().source());
        }
    }

    public static void recordFallback(Span span, String reason) {
        span.setAttribute("rag.fallback.reason", reason);
    }

    public static void recordModelUsage(Span span, String model, long ttftMs, int tokens) {
        span.setAttribute("rag.model.name", model);
        span.setAttribute("rag.ttft_ms", ttftMs);
        span.setAttribute("rag.tokens.total", tokens);
    }
}
In Grafana Tempo, you can:
- Filter traces by
rag.cache.hit=false(cache misses) - Find slow requests by
rag.ttft_ms > 1000(first token > 1 second) - Identify fallback triggers by
rag.fallback.reason=weaviate-timeout
Prometheus Metrics
Spring Boot Actuator exposes Prometheus metrics at /actuator/prometheus. The retriever and orchestrator emit custom metrics:
// Orchestrator metrics
this.askLatency = Timer.builder("rag_orchestrator_latency")
        .description("End-to-end /v1/ask latency")
        .register(meterRegistry);

this.cacheHitCounter = Counter.builder("rag_cache_hit_total")
        .description("Semantic cache hits")
        .register(meterRegistry);

this.tokensCounter = Counter.builder("rag_tokens_generated_total")
        .description("Total tokens generated by model responses")
        .register(meterRegistry);

this.costSummary = DistributionSummary.builder("rag_cost_usd_total")
        .description("Approximate request cost in USD")
        .register(meterRegistry);
Prometheus scrapes these metrics every 15 seconds:
# deploy/prometheus.yaml

scrape_configs:
  - job_name: 'retriever'
    kubernetes_sd_configs:
      - role: pod
        namespaces:
          names:
            - rag
    relabel_configs:
      - source_labels: [__meta_kubernetes_pod_annotation_prometheus_io_scrape]
        action: keep
        regex: true
      - source_labels: [__meta_kubernetes_pod_annotation_prometheus_io_path]
        action: replace
        target_label: __metrics_path__
        regex: (.+)
Grafana Dashboards
The Grafana dashboard visualizes key RAG metrics:
┌─────────────────────────────────────────────────────────────┐
│ RAG Pipeline Dashboard                                      │
├─────────────────────────────────────────────────────────────┤
│ Cache Hit Rate:  47.3%  │  Avg Latency:     847ms           │
│ Total Requests:  12.4k  │  p95 Latency:    1.32s            │
│ Fallback Rate:    8.2%  │  p99 Latency:    2.15s            │
│ Estimated Cost: $14.32  │  Tokens/sec:      142             │
├─────────────────────────────────────────────────────────────┤
│ [Line chart: Request rate over time (RPS)]                  │
│ [Line chart: Cache hit ratio (percentage)]                  │
│ [Line chart: Latency percentiles (p50/p95/p99)]             │
│ [Bar chart: Replica count by service]                       │
│ [Line chart: Token throughput (tokens/sec)]                 │
│ [Line chart: Estimated cost per request]                    │
└─────────────────────────────────────────────────────────────┘
Key metrics to watch:
-
Cache hit ratio: Should be >40% for typical workloads. If <20%, investigate query distribution or lower similarity threshold.
-
p95 latency: Should be <2 seconds. If higher, check:
- Retrieval timeout settings (too aggressive?)
- LLM TTFT (model overloaded?)
- Network latency (cross-region calls?)
-
Fallback rate: Should be <10%. If higher, investigate:
- Weaviate performance (slow queries, resource exhaustion)
- Timeout settings (too strict?)
-
Token throughput: Tracks LLM utilization. If low despite high traffic, you might need more GPU instances.
-
Cost per request: Average should be ~$0.001-$0.005 depending on token generation. Spikes indicate cache misses or long responses.
Load Testing and Performance Tuning
Load testing validates autoscaling and identifies bottlenecks. The repo includes a k6 script:
// scripts/loadtest-k6.js

import http from 'k6/http';
import { check, sleep } from 'k6';

export let options = {
  stages: [
    { duration: '1m', target: 10 },   // Ramp to 10 RPS
    { duration: '3m', target: 30 },   // Sustain 30 RPS
    { duration: '1m', target: 50 },   // Spike to 50 RPS
    { duration: '2m', target: 10 },   // Cool down to 10 RPS
    { duration: '1m', target: 0 },    // Drain
  ],
};

export default function () {
  const queries = [
    'How does autoscaling work?',
    'Explain the caching mechanism',
    'What is the fallback strategy?',
    'How do I deploy to Kubernetes?',
    'What observability tools are used?',
  ];

  const prompt = queries[Math.floor(Math.random() * queries.length)];
  const payload = JSON.stringify({ prompt, topK: 5 });

  const res = http.post('http://localhost:8080/v1/ask', payload, {
    headers: { 'Content-Type': 'application/json' },
  });

  check(res, {
    'status is 200': (r) => r.status === 200,
    'response time < 3s': (r) => r.timings.duration < 3000,
    'has answer': (r) => JSON.parse(r.body).answer.length > 0,
  });

  sleep(1);
}
Run the test:
make port-forward  # In one terminal
k6 run scripts/loadtest-k6.js  # In another terminal
Watch in Grafana:
- Retriever replicas scale from 2→10→20 as RPS increases
- Cache hit ratio stabilizes around 45% after warm-up
- p95 latency stays <2s despite traffic spike
- Fallback rate increases slightly during peak (10-15%)
Tuning recommendations:
- If p95 latency > 2s: Increase retriever
maxReplicasor lower HPA CPU threshold to 60% - If fallback rate > 15%: Increase Weaviate timeout from 250ms to 500ms
- If cache hit ratio < 30%: Lower similarity threshold from 0.90 to 0.85 (validate answer quality)
- If cost per request > $0.01: Reduce
max_tokensin LLM config or improve prompt efficiency
Cost Optimization Strategies
Running LLMs in production is expensive. Here's how to minimize cost without sacrificing quality:
1. Semantic Caching
Cache hit ratio of 45% means you're avoiding 45% of LLM calls. At ~$0.002 per request, that's ~$0.001 saved per cached request. For 100k requests/day:
- Without cache: $200/day
- With 45% cache hit: $110/day
- Savings: $90/day = $32,850/year
2. KServe Scale-to-Zero
If your traffic has idle periods (e.g., nights, weekends), scale-to-zero saves GPU costs:
- L4 GPU: $0.60/hour = $14.40/day
- If idle 50% of the time: $7.20/day savings = $2,628/year
3. Spot/Preemptible Instances
GKE supports spot instances (70% discount on compute):
- Standard
g2-standard-4: $0.35/hour - Spot
g2-standard-4: $0.10/hour - Savings: $0.25/hour = $6/day = $2,190/year
Caveat: Spot instances can be preempted. Use them for stateless services (retriever, orchestrator) but not for stateful stores (Redis, databases).
4. Right-Sizing Resources
Monitor actual resource usage in Grafana:
- If retriever CPU consistently <50%, reduce
requests.cpufrom200mto100m - If orchestrator memory consistently <200MB, reduce
requests.memoryfrom256Mito128Mi
Over-provisioning wastes money. Under-provisioning causes OOM kills. Find the sweet spot.
Why Kubernetes can be an option for running LLM apps
Let's revisit the original question: why Kubernetes for LLM workloads?
Because Kubernetes provides:
- GPU orchestration: Dynamic allocation, multi-tenancy, isolation
- Heterogeneous scaling: Independent scaling per component (HPA, KEDA, KServe)
- Service mesh: Discovery, load balancing, retries, circuit breaking
- Deployment primitives: Canary, blue-green, rolling updates, rollbacks
- Observability integration: Prometheus, Tempo, Grafana, OpenTelemetry
- Cost optimization: Spot instances, autoscaling, scale-to-zero
- Portability: Run in GCP (GKE), AWS (EKS), Azure (AKS), on-prem
LLM applications are distributed systems. They have complex dependencies, heterogeneous resource requirements, and demanding operational SLOs. Kubernetes is purpose-built for this.
Yes, there's a learning curve. Yes, it's more complex. But the operational benefits—reliability, scalability, observability, cost efficiency—are undeniable.
Wrapping Up
We've built a production-grade RAG system from the ground up:
Part 1: We discussed the core challenges (latency, reliability, cost, quality, observability)
Part 2: We designed a resilient architecture with semantic caching, hybrid retrieval, graceful degradation, and comprehensive instrumentation
Part 3: We outlined the K8S deployment with intelligent autoscaling (HPA, KEDA, KServe), full observability (Prometheus, Tempo, Grafana), and cost optimization
The patterns here, service isolation, reactive programming, timeouts, fallbacks, tracing, metrics, autoscaling, are how you build systems that serve millions of users.
The code is open source: github.com/aboullaite/rag-java-k8s
Thanks for following along this series! If you have questions or want to discuss RAG architectures, Kubernetes patterns, or LLM infrastructure, find me on Twitter or LinkedIn.
Now go build something great.