
Needless to say how important monitoring and observability is, especially in a cloud native, distributed world! No system should got to production without having monitoring tools in place.
On the other hand, the devops movement and cloud native era introduced a plethora of tools to run, deploy and monitor our application, which drastically increased there complexity.
With the increased number of tooling and the complexity of our architectures, developers find themselves in an ever growing challenge to debug their systems, spot bottlenecks, identify hotspots or improve system performance.

Enter Pixie!
I recently stumbled upon a new CNCF tool called Pixie, An open source observability tool to K8S applications. Pixie was contributed by New Relic to CNCF in 2021.
What triggered my interest for Pixie is, unlike other observability tools (at least that I know of), the focus on developers and DX (developer experience). Pixie offers both a high-level state overview of the k8s cluster, as well as drill down, more tailored, granular and detailed view of the health and performance of your app.
Pixie uses eBPF to collect metrics and events, without the need for manual instrumentation (code changes, redeploys ...). Pixie also stores and compute telemetry data in-memory within the cluster. Collected data is retained for up to 24h, with the possibility to export them in the openTelemetry format to your favorite monitoring tool for long term retention.
The heavy-lifting-done-locally approach that Pixie offers comes with a cost nevertheless. It has the advantage to ensure better security (no data needs to leave your cluster) and scalability. However the performance overhead for node CPU usage is between 2-5% as Pixie claims, and requires at least 1GiB memory requirement per node.
Pixie in action!
For the demo, I created a standard K8S cluster in GKE, since Autopilot mode is still not supported in pixie.
Installing Pixie is pretty straighforward, just run:
$ bash -c "$(curl -fsSL https://withpixie.ai/install.sh)"
A prompt will appear asking you to signin or register for a Pixie account.
Once authenticated, we can deploy Pixie on our GKE cluster using:
$ px deploy
This would install, among other things, Viser Pixie's data plane, responsible for collecting and processing data within the cluster that is being monitored.
For convenience, I reused the manifests from my service mesh demo, based on sock-shop microservices app from Weaveworks.
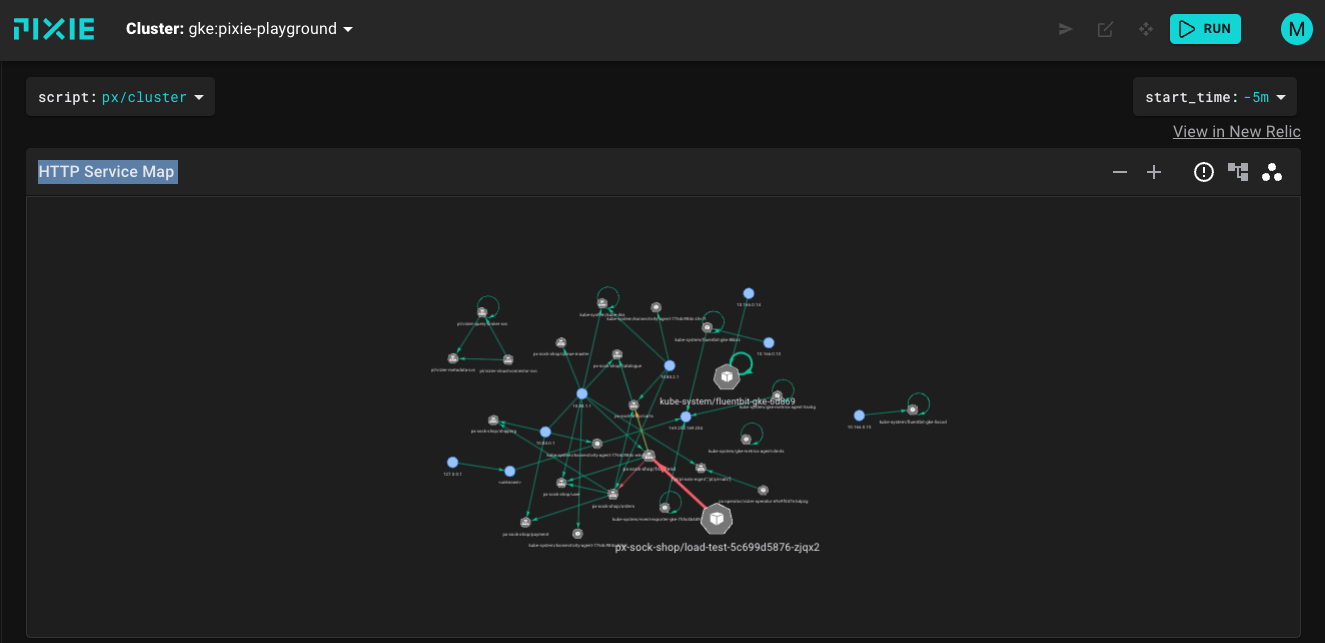
Pixie, support interacting with the platform using 3 ways: CLI, web-based Live UI or API. Unsurprisingly, using the web UI is the easiest and most intuitive way to interact with Pixie and check you data, especially if you are new to it.
Once connected to Pixie Console UI, you'd need to select which cluster to interact with to and which script to execute. PxL Scripts uses Pixie Language (PxL) DSL to query cluster data and transform/visualize metrics.
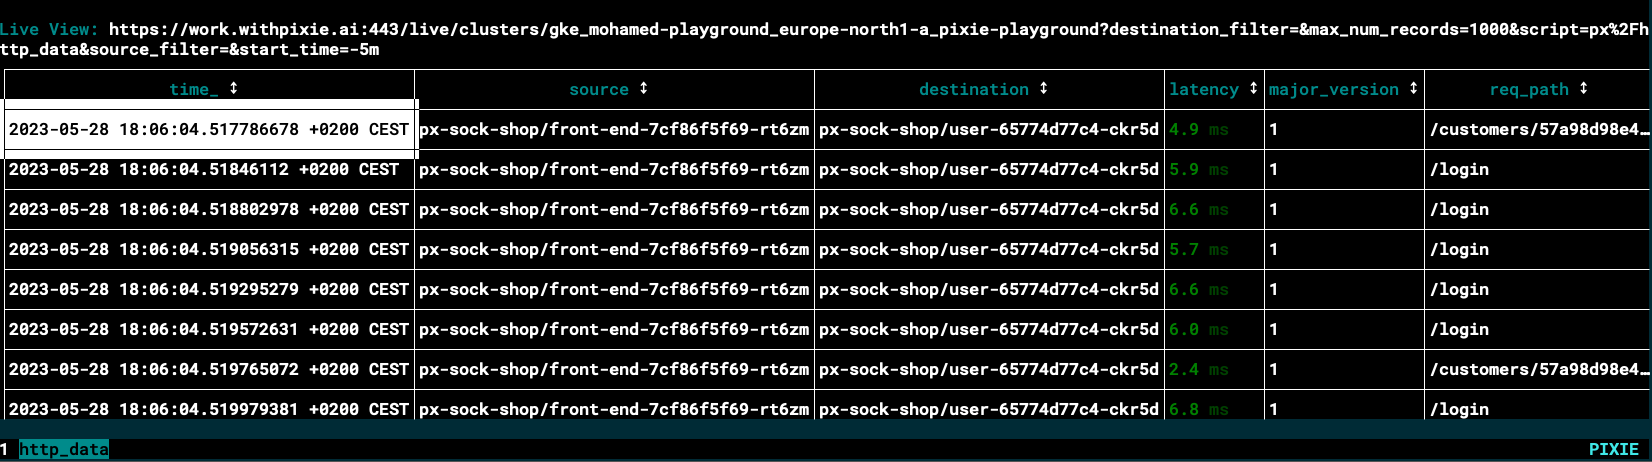
Pixie CLI is as fun as to play with as the web UI, it is rich and interactive. You can use px help to list all Pixie CLI options, and px scripts list to list all built-in scripts. Below is an image of running px live px/http_data script which shows a sample of the HTTP/2 traffic flowing through your cluster. Notice the link above that sends you to the web UI which is very convenient to go back and forth.
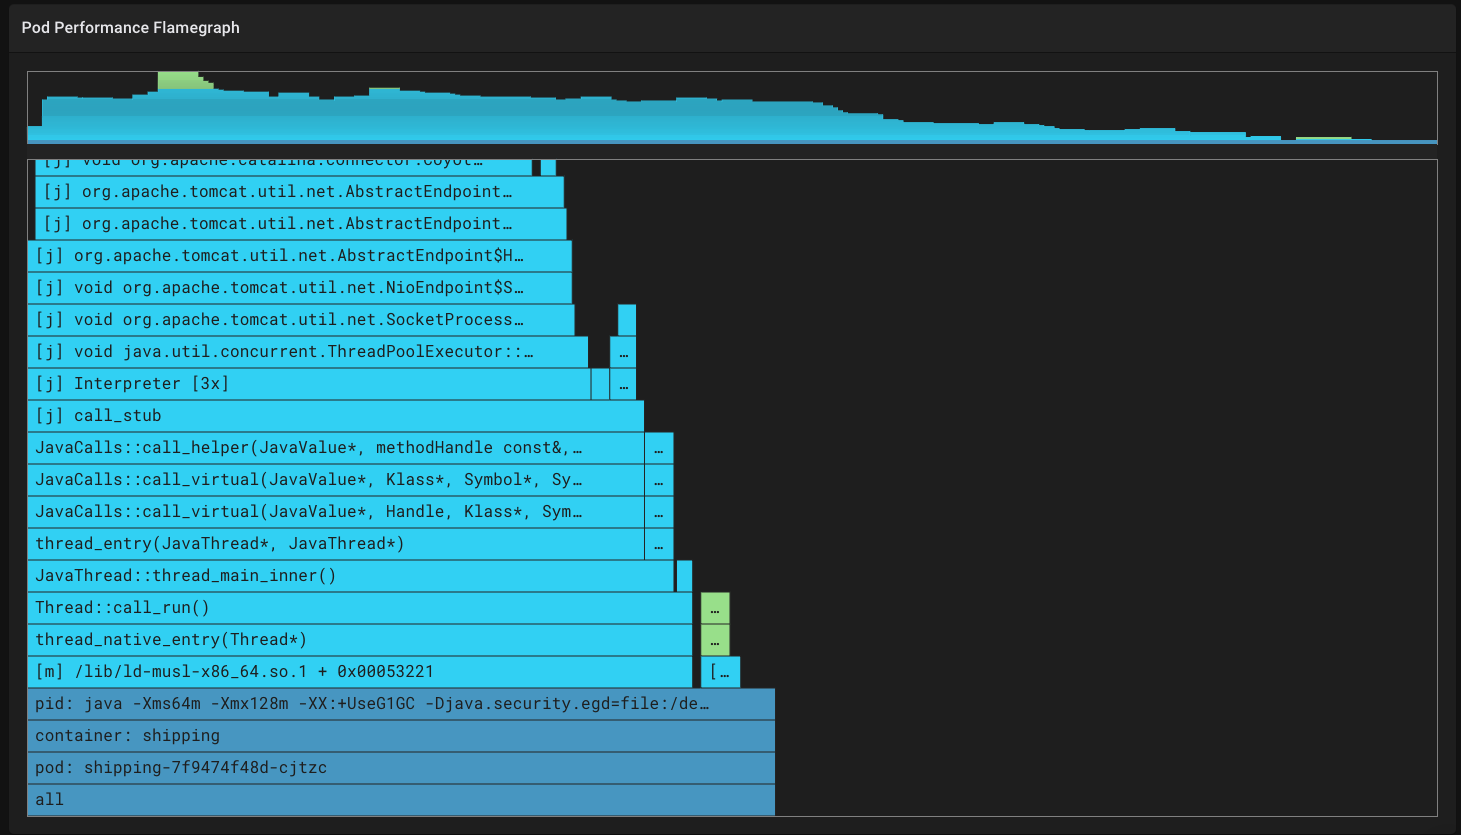
A great example of Pixie usage is application profiling, to detect hotspot and analyse CPU spikes. Pixie's px/pod gives an overview of the high level application metrics (latency, error, throughput ...) and resource utilization for the selected pod. What excited me is the Pod Performance Flamegraph at the end of the page whic is greatly useful to identify performance issues. You can see an example below of the CPU spike in the beginning of the java orders app while the JVM is warming up and JIT is executed, while slowly cooling down as the compilation finishes.
Those are just a few of the many features and options that Pixies offers (Which I am still uncovering myself). head over to the documentation page to read more about it!