An introduction to Spring Boot Actuator
Spring Boot ships with a module called actuator which enables things like metrics and statistics about your application. For example, we can collect logs, view metrics, perform thread dumps, show environment variables, understand garbage collection, and show what beans are configured in the BeanFactory. You can expose this information via HTTP, JMX, or you can even log in directly to the process via SSH.
Expose Application Metrics and Information
So you've successfully developed your Spring boot app and now you want to deploy it into production, how will you
monitor it? How can you get any insight about how things are running? Often our microservices are black boxes unless we explicitly think through how we want to expose metrics to the outside world.
Spring Boot comes with a prepackaged starter called actuator that makes doing this a breeze.
Enable actuator
To start using the existing actuators in Boot – we’ll just need to add the spring-boot-actuator dependency to the pom:
<dependency>
  <groupId>org.springframework.boot</groupId>
  <artifactId>spring-boot-starter-actuator</artifactId>
  <version>1.4.2.RELEASE</version>
</dependency>
That’s it? Yes! You have now added the actuator to your existing application. When you restart your application, endpoints are enabled for the user access. More detailed configurations and customization of the metrics are explained in the future sections.
Actuator Endpoints
Just by adding the actuator dependency, our application now has a lot of information exposed that would be very handy for debugging or general microservice insight.
Most endpoints are sensitive – meaning they’re not fully public – while a handful is not: /health and /info.
Here are some of the most common endpoints Boot provides out of the box:
/health– Shows application health information (a simple ‘status’ when accessed over an unauthenticated connection or full message details when authenticated). It is not sensitive by default./info– Displays arbitrary application info. Not sensitive by default./metrics– Shows ‘metrics’ information for the current application. It is also sensitive by default./trace– Displays trace information (by default the last few HTTP requests).
You can find the full list of existing endpoints over on the official docs.
Customizing the management server port
Exposing management endpoints using the default HTTP port is a sensible choice for cloud based deployments. If, however, your application runs inside your own data center you may prefer to expose endpoints using a different HTTP port.
The management.port property can be used to change the HTTP port.
management.port=8081
Security
Most of the times, the details exposed via the endpoints are sensitive and requires authorized user to view the details. You can add spring security to secure your endpoints. Just add the dependency, when the spring security files are available in the classpath, it will be automatically configured.
<dependency>
  <groupId>org.springframework.boot</groupId>
  <artifactId>spring-boot-starter-security</artifactId>
</dependency>
By default, the basic security enabled. This will be enabled for all the endpoints. But, you can disable them by updating the application.properties file and expose the non-sensitive endpoints without security.
The following are the basic entries that are required to configure the security for your spring boot actuator application:
management.security.enabled=true
security.basic.enabled=true
security.user.name=admin
security.user.password=admin
In the above configurations, we are enabling the basic security and providing a username and password to access the endpoints. When user tries to access the endpoints, there will be pop-up on the browser to authenticate the user with credentials.
Customizing Endpoints
Each endpoint can be customized with properties using the following format: endpoints.[endpoint name].[property to customize]
Three properties are available:
- id – by which this endpoint will be accessed over HTTP
- enabled – if true then it can be accessed otherwise not
- sensitive – if true then need the authorization to show crucial information over HTTP.
For example, add the following properties will customize the /beans endpoint:
endpoints.beans.id=springbeans
endpoints.beans.sensitive=false
endpoints.beans.enabled=true
Health endpoint
The /health endpoint is used to check the health/status of the running application. It’s usually used by basic monitoring software to alert you if the production goes down.
By default only health information is shown to unauthorized access over HTTP:
{
   "status" : "UP"
}
This health information is collected from all the beans implementing HealthIndicator interface configured in your application context.
Some information returned by HealthIndicator is sensitive in nature – but you can configure endpoints.health.sensitive=false to expose the other information like disk space, data source etc.
Custom Health Endpoint
You can also roll your own custom health indicator. One can extend the HealthIndicator interface and provide their own implementation. CustomHealthCheck is implementing the method health() which is declared in the interface HealthIndicator. When you create a custom class of this type and override the method health(), the default functionality will be overwritten by your custom logic.
        @Component
        public class CustomHealthCheck implements HealthIndicator {
        	public Health health() {
        		int errorCode = 0;
        		if (errorCode != 1) {
        			return Health.down().withDetail("Error Code", errorCode).build();
        		}
        		return Health.up().build();
        	}

        }
The output will be:
    {
      "status": "DOWN",
      "customHealthCheck": {
        "status": "DOWN",
        "Error Code": 0
      },
      "diskSpace": {
        "status": "UP",
        "free": 19593824409432,
        "threshold": 15485791
      }
    }
info Endpoint
You can also customize the data shown by /info endpoint – for example:
    endpoints.info.id=info
    endpoints.info.sensitive=false
    endpoints.info.enabled=true
    info.app.name=Spring Actuator Example
    info.app.description=Simple project of Spring Actuator with examples
    info.app.version=0.0.1-SNAPSHOT
And the sample output:
        {
           "app": {
             "version": "0.0.1-SNAPSHOT",
             "description": "Simple project of Spring Actuator with examples",
             "name": "Spring Actuator Example"
           }
        }
Metrics Endpoint
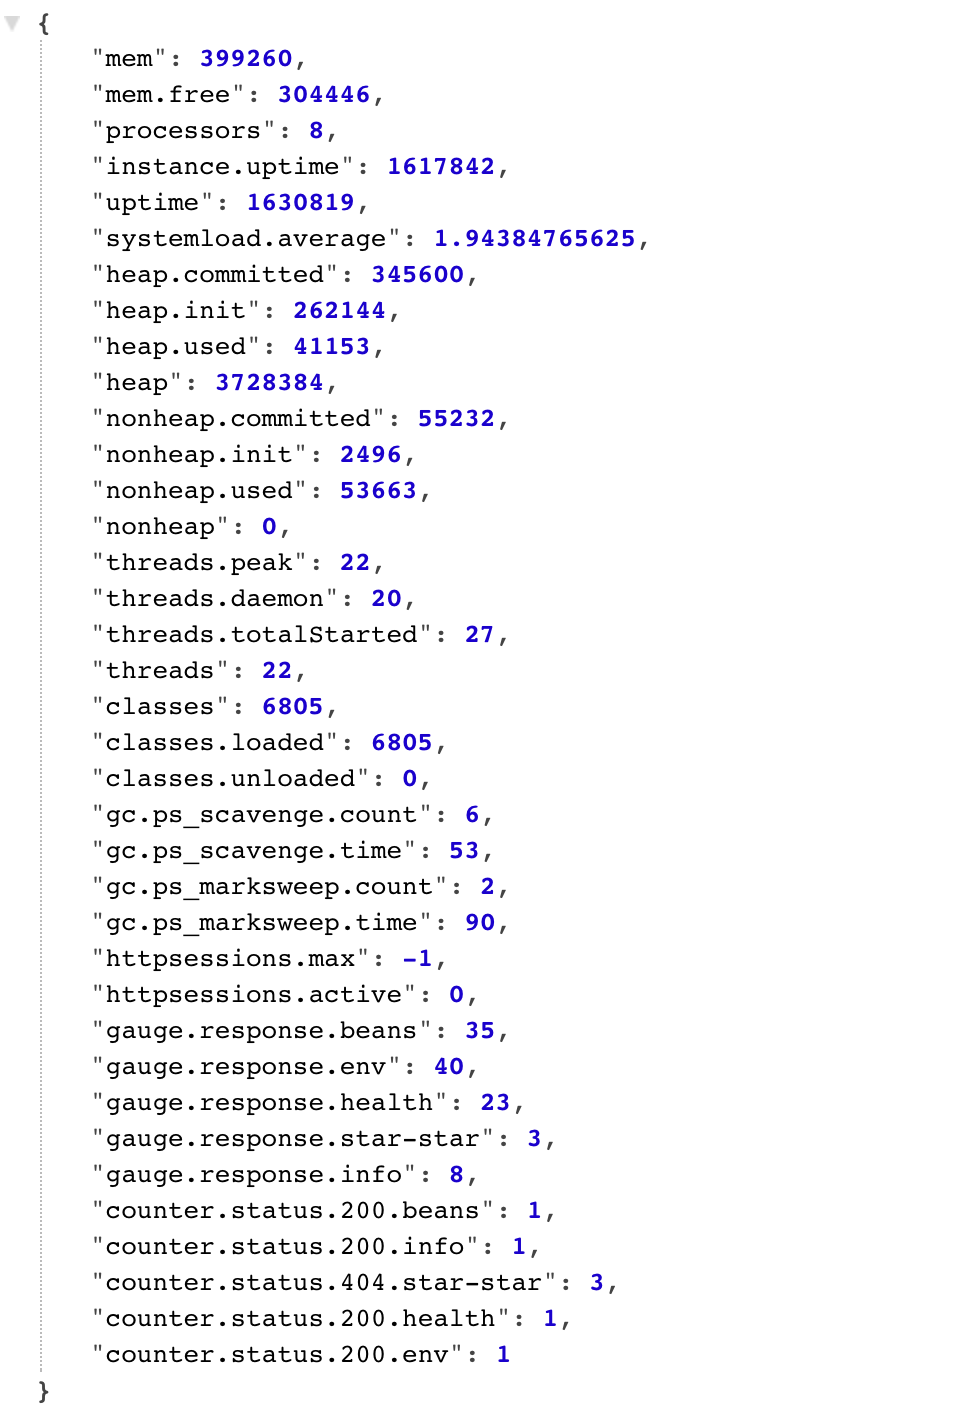
The metrics endpoint is one of the more important endpoints as it gathers and publishes information about OS, JVM and Application level metrics; out of the box, we get things like memory, heap, processors, threads, classes loaded, classes unloaded, thread pools along with some HTTP metrics as well.
Here’s what the output of this endpoint looks like out of the box:

Dump Endpoint
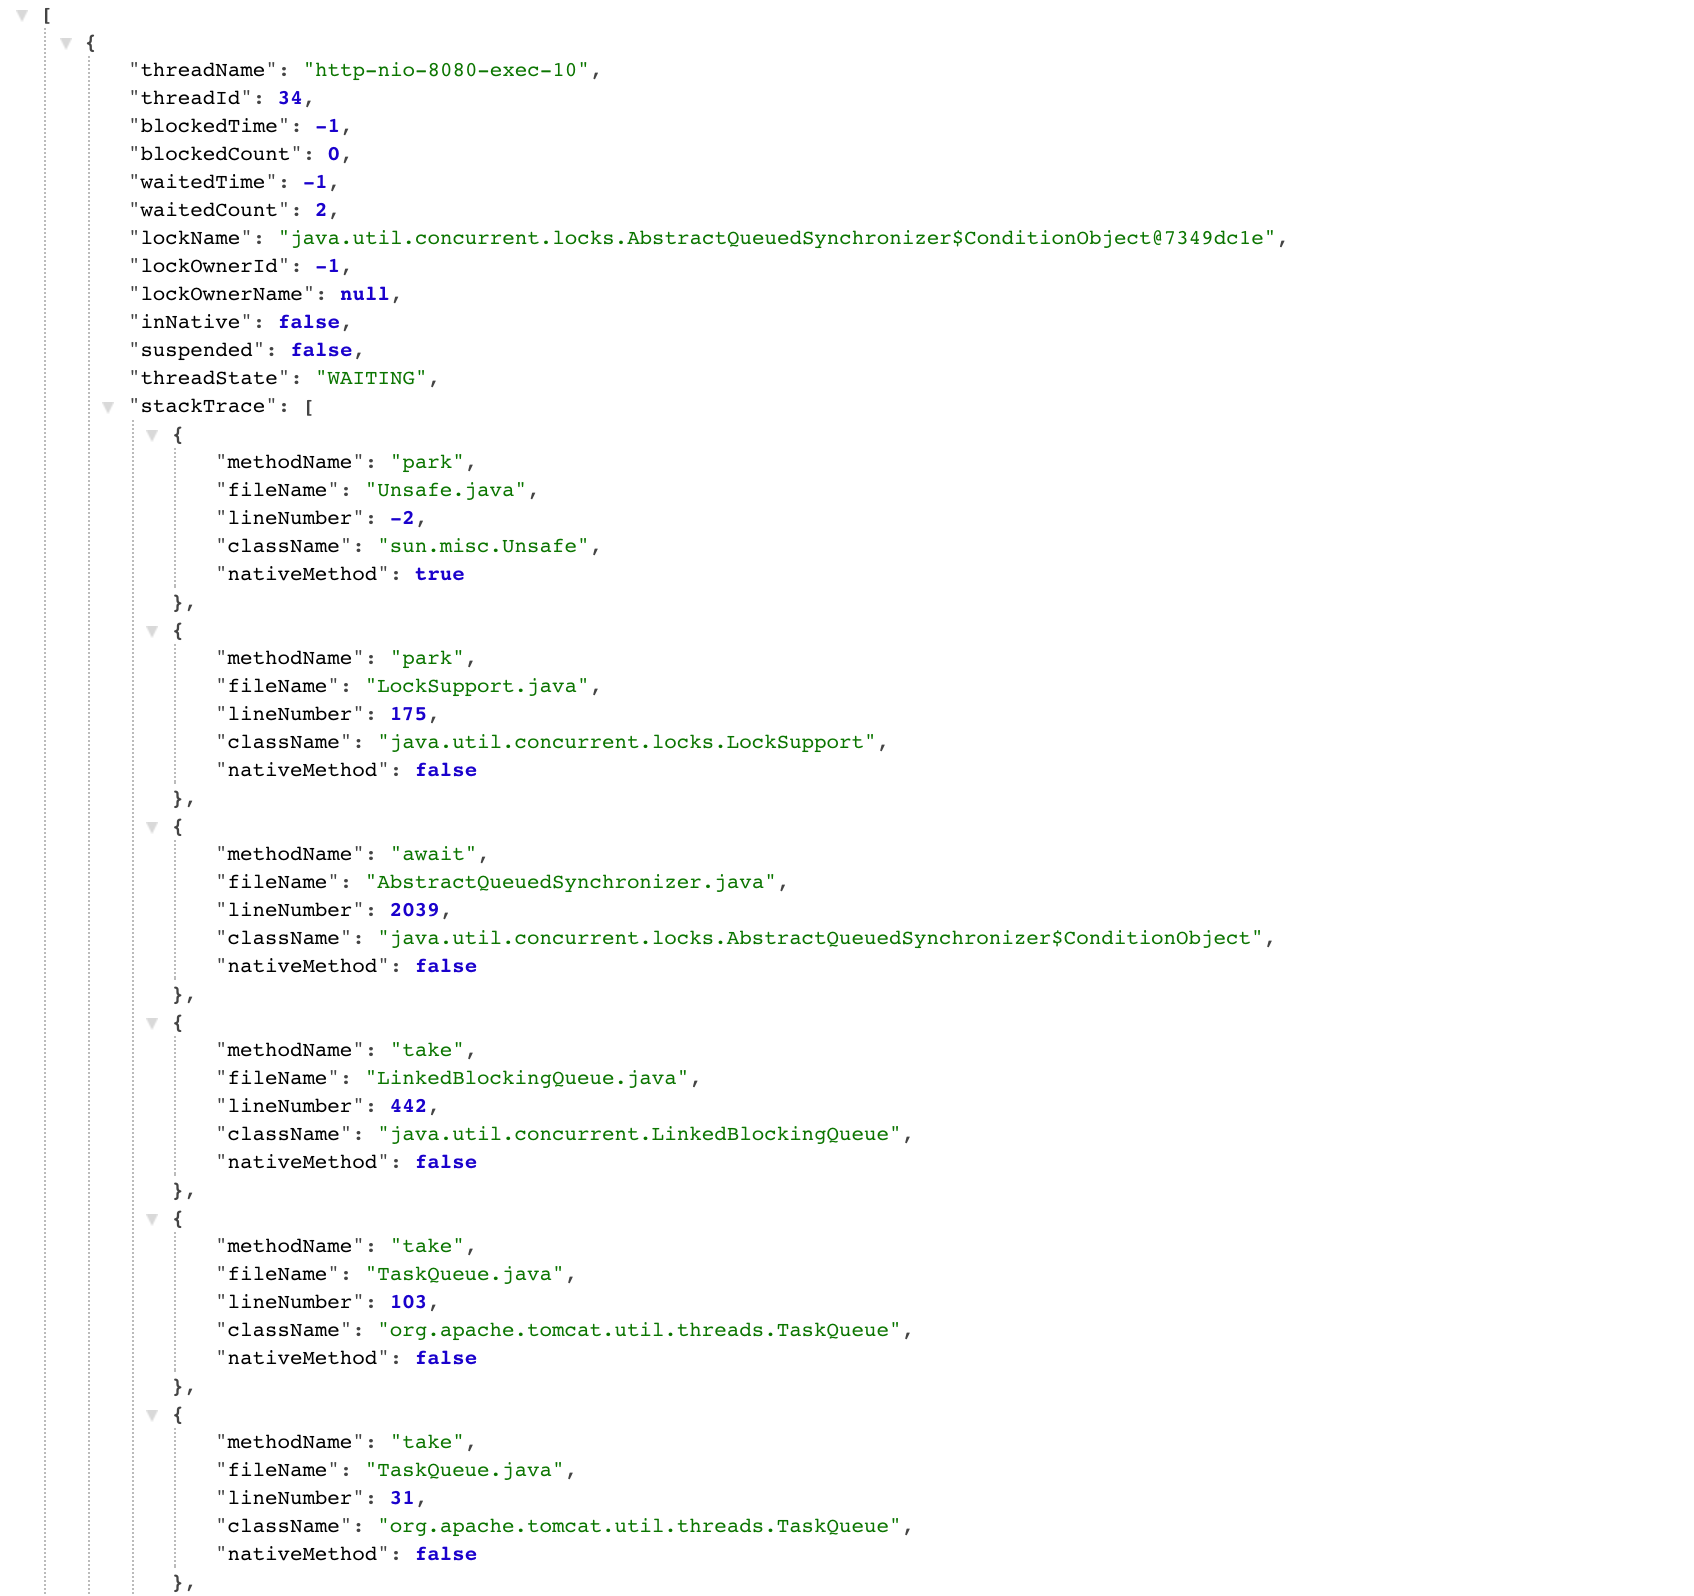
Thread dumps are important when your application encounters any performance issues. In normal scenarios, you have to request the production server administrator to take the thread dumps at the frequent intervals and send across to you for the analysis. But, that takes lot of time and also you would require the thread dumps only when the actual performance issue arises.
This end point is would offer real benefits to the production applications to get the thread dumps just by accessing the application using browser. It is awesome to see spring boot offers such an excellent features for the production application. Long live spring boot :)

Custom Endpoint Implementation
Apart from the above default endpoints exposed by spring boot, We can write our own endpoints by implementing the interface Endpoint. This is useful when you want to expose application details which are an added feature to your application. For example, in this example I have created a custom endpoint to display the server details for the application.
The implementation class would looks like this:
      @Component
      public class ServerEndpoint implements Endpoint<List<String>> {

      	public String getId() {
      		return "server";
      	}

      	public List<String> invoke() {
      		List<String> serverDetails = new ArrayList<String>();
      		try {
      			serverDetails.add("Server IP Address : " + InetAddress.getLocalHost().getHostAddress());
      			serverDetails.add("Server OS : " + System.getProperty("os.name").toLowerCase());
      		} catch (Exception e) {
      			e.printStackTrace();
      		}
      		return serverDetails;
      	}

      	public boolean isEnabled() {
      		return true;
      	}

      	public boolean isSensitive() {
      		return false;
      	}

      }
Here’s what the output might look like:
["Server IP Address : 192.168.1.164","Server OS : Mac OS X"]
List All The Endpoints
It is quite useful if you have an endpoint to display all the endpoints in a single web page. There is a built-in endpoint /actuator for this purpose, but you have to add HateOAS in the classpath to enable that feature.
We could write a custom endpoint in the similar way how we have written in the above section to print the endpoints. The following class extends AbstractEndpoint to list all endpoints.
Sample implementation is :
    @Component
    public class ShowEndpoints extends AbstractEndpoint<List<Endpoint>>{

    	private List<Endpoint> endpoints;

        @Autowired
        public ShowEndpoints(List<Endpoint> endpoints) {
            super("showEndpoints");
            this.endpoints = endpoints;
        }

        public List<Endpoint> invoke() {
            return this.endpoints;
        }
    }
When you implement the above class, there will be a new endpoint “showEndpoints” will be registered and exposed to the users. The output will be:
    [
      {
        "sensitive": false,
        "id": "server",
        "enabled": true
      },
      {
        "id": "mappings",
        "sensitive": true,
        "enabled": true
      },
      {
        "id": "env",
        "sensitive": true,
        "enabled": true
      },
      {
        "id": "health",
        "sensitive": true,
        "enabled": true,
        "timeToLive": 1000
      },
      {
        "id": "beans",
        "sensitive": true,
        "enabled": true
      },
      {
        "id": "info",
        "sensitive": false,
        "enabled": true
      },
      {
        "id": "metrics",
        "sensitive": true,
        "enabled": true
      },
      {
        "id": "trace",
        "sensitive": true,
        "enabled": true
      },
      {
        "id": "dump",
        "sensitive": true,
        "enabled": true
      },
      {
        "id": "autoconfig",
        "sensitive": true,
        "enabled": true
      },
      {
        "id": "shutdown",
        "sensitive": true,
        "enabled": false
      },
      {
        "id": "configprops",
        "sensitive": true,
        "enabled": true
      }
    ]
That's it folks!

